Foundations of Trigonometry
Trigonometry is one of the most detailed sections of the National 5 curriculum. The material below is designed to provide a foundational understanding of the key concepts underpinning the study of trigonometry that will be expanded upon in the topics which follow.
Sine, cosine and tangent (often shortened to \sin{}, \cos{} and \tan{}) are functions which define ratios between the sides of a right-angled triangle.
The sine, cosine and tangent functions are defined as follows:
\begin{aligned}\boldsymbol{\sin{x}}&=\boldsymbol{\frac{opposite}{hypotenuse}} \\[12pt]\boldsymbol{\cos{x}}&=\boldsymbol{\frac{adjacent}{hypotenuse}} \\[12pt]\boldsymbol{\tan{x}}&=\boldsymbol{\frac{opposite}{adjacent}}\end{aligned}
As they are functions, \sin{x}, \cos{x} and \tan{x} require an input in order to produce an output (see the “Function notation” topic for more detail on functions). \sin{x}, \cos{x} and \tan{x} each take an angle from a right-angled triangle as an input; this angle is usually labelled x or \theta and is called the “angle of interest” (by the way \theta is pronounced “Theta” if you didn’t know). Using this angle as an input, the \sin{x}, \cos{x} and \tan{x} functions produce outputs which are equivalent to the ratios of different sides of a right-angled triangle.
The three sides of a right-angled triangle are called the hypotenuse, the opposite and the adjacent. As you already know, the hypotenuse is the longest side (always directly opposite the right angle), but labelling the opposite and the adjacent correctly depends on which angle is chosen to be the angle of interest:

The hypotenuse is the same side in both triangles above since the hypotenuse is always the longest side by default. The opposite, as the name suggests, is always directly opposite the angle of interest, so for different angles of interest the opposite side changes. It should be pretty easy to first label the hypotenuse and opposite for any triangle, then the adjacent is simply the side left over.
In short, the \boldsymbol{\sin{}}, \boldsymbol{\cos{}} and \boldsymbol{\tan{}} functions define relationships between the sides and the angles of right-angled triangles.
Using these functions, as long as you know either:
– One side and one angle; or
– Two sides
You will always be able to calculate the lengths of the other missing sides or angles.
This is a significant step up from Pythagoras’ Theorem which only offers a relationship between the sides of a right-angled triangle. Pythagoras’ Theorem provides no information whatsoever on the angles.
Because they include information about a right-angled triangle’s angles, the \sin, \cos and \tan functions significantly expand the universe of problems you can solve using trigonometry (as you will see in the rest of the topics in this module).
Depending on the information you have about a triangle, it will be appropriate to use either the \sin{}, \cos{} or \tan{} function. To help you decide which function to use, it is useful to remember the mnemonic SOH CAH TOA:

At this stage it useful to start thinking about how the \sin{x}, \cos{x}, and \tan{x} functions might look when we sketch them. As always, when faced with a new type of function it is often useful to create a simple coordinate table and plot the points to get a feel for how the function gets its shape.
Let’s start with y=\sin{x}. We will plot this for x values ranging from 0^\circ to 360^\circ, so we therefore say that this function has a domain of 0^\circ\leq x\leq360^\circ. In simple terms, the domain defines the set of all permitted \boldsymbol{x} values for a particular function, which in this case range from 0^\circ, 1^\circ, 2^\circ... 359^\circ, 360^\circ.
For starters, let’s plot just a few coordinates going up in 45^\circ increments. Plug each of these x values into the \sin{x} function in your calculator and you will get the following results:
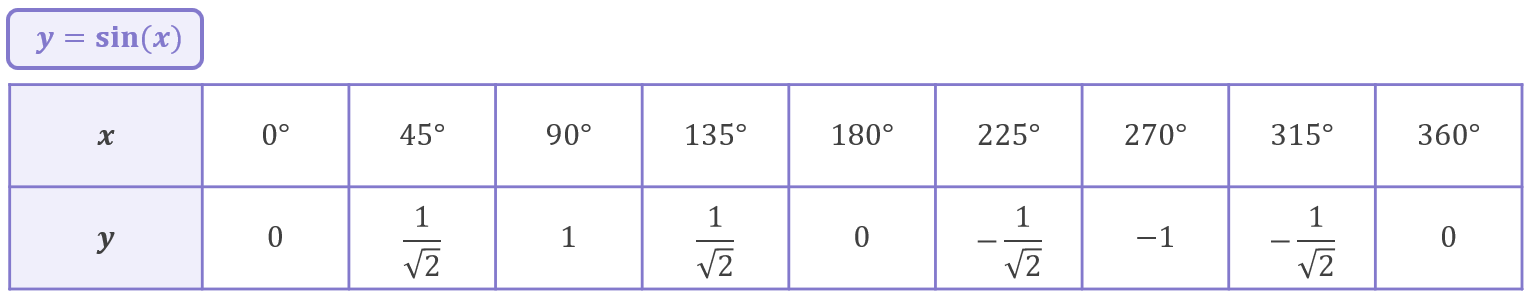
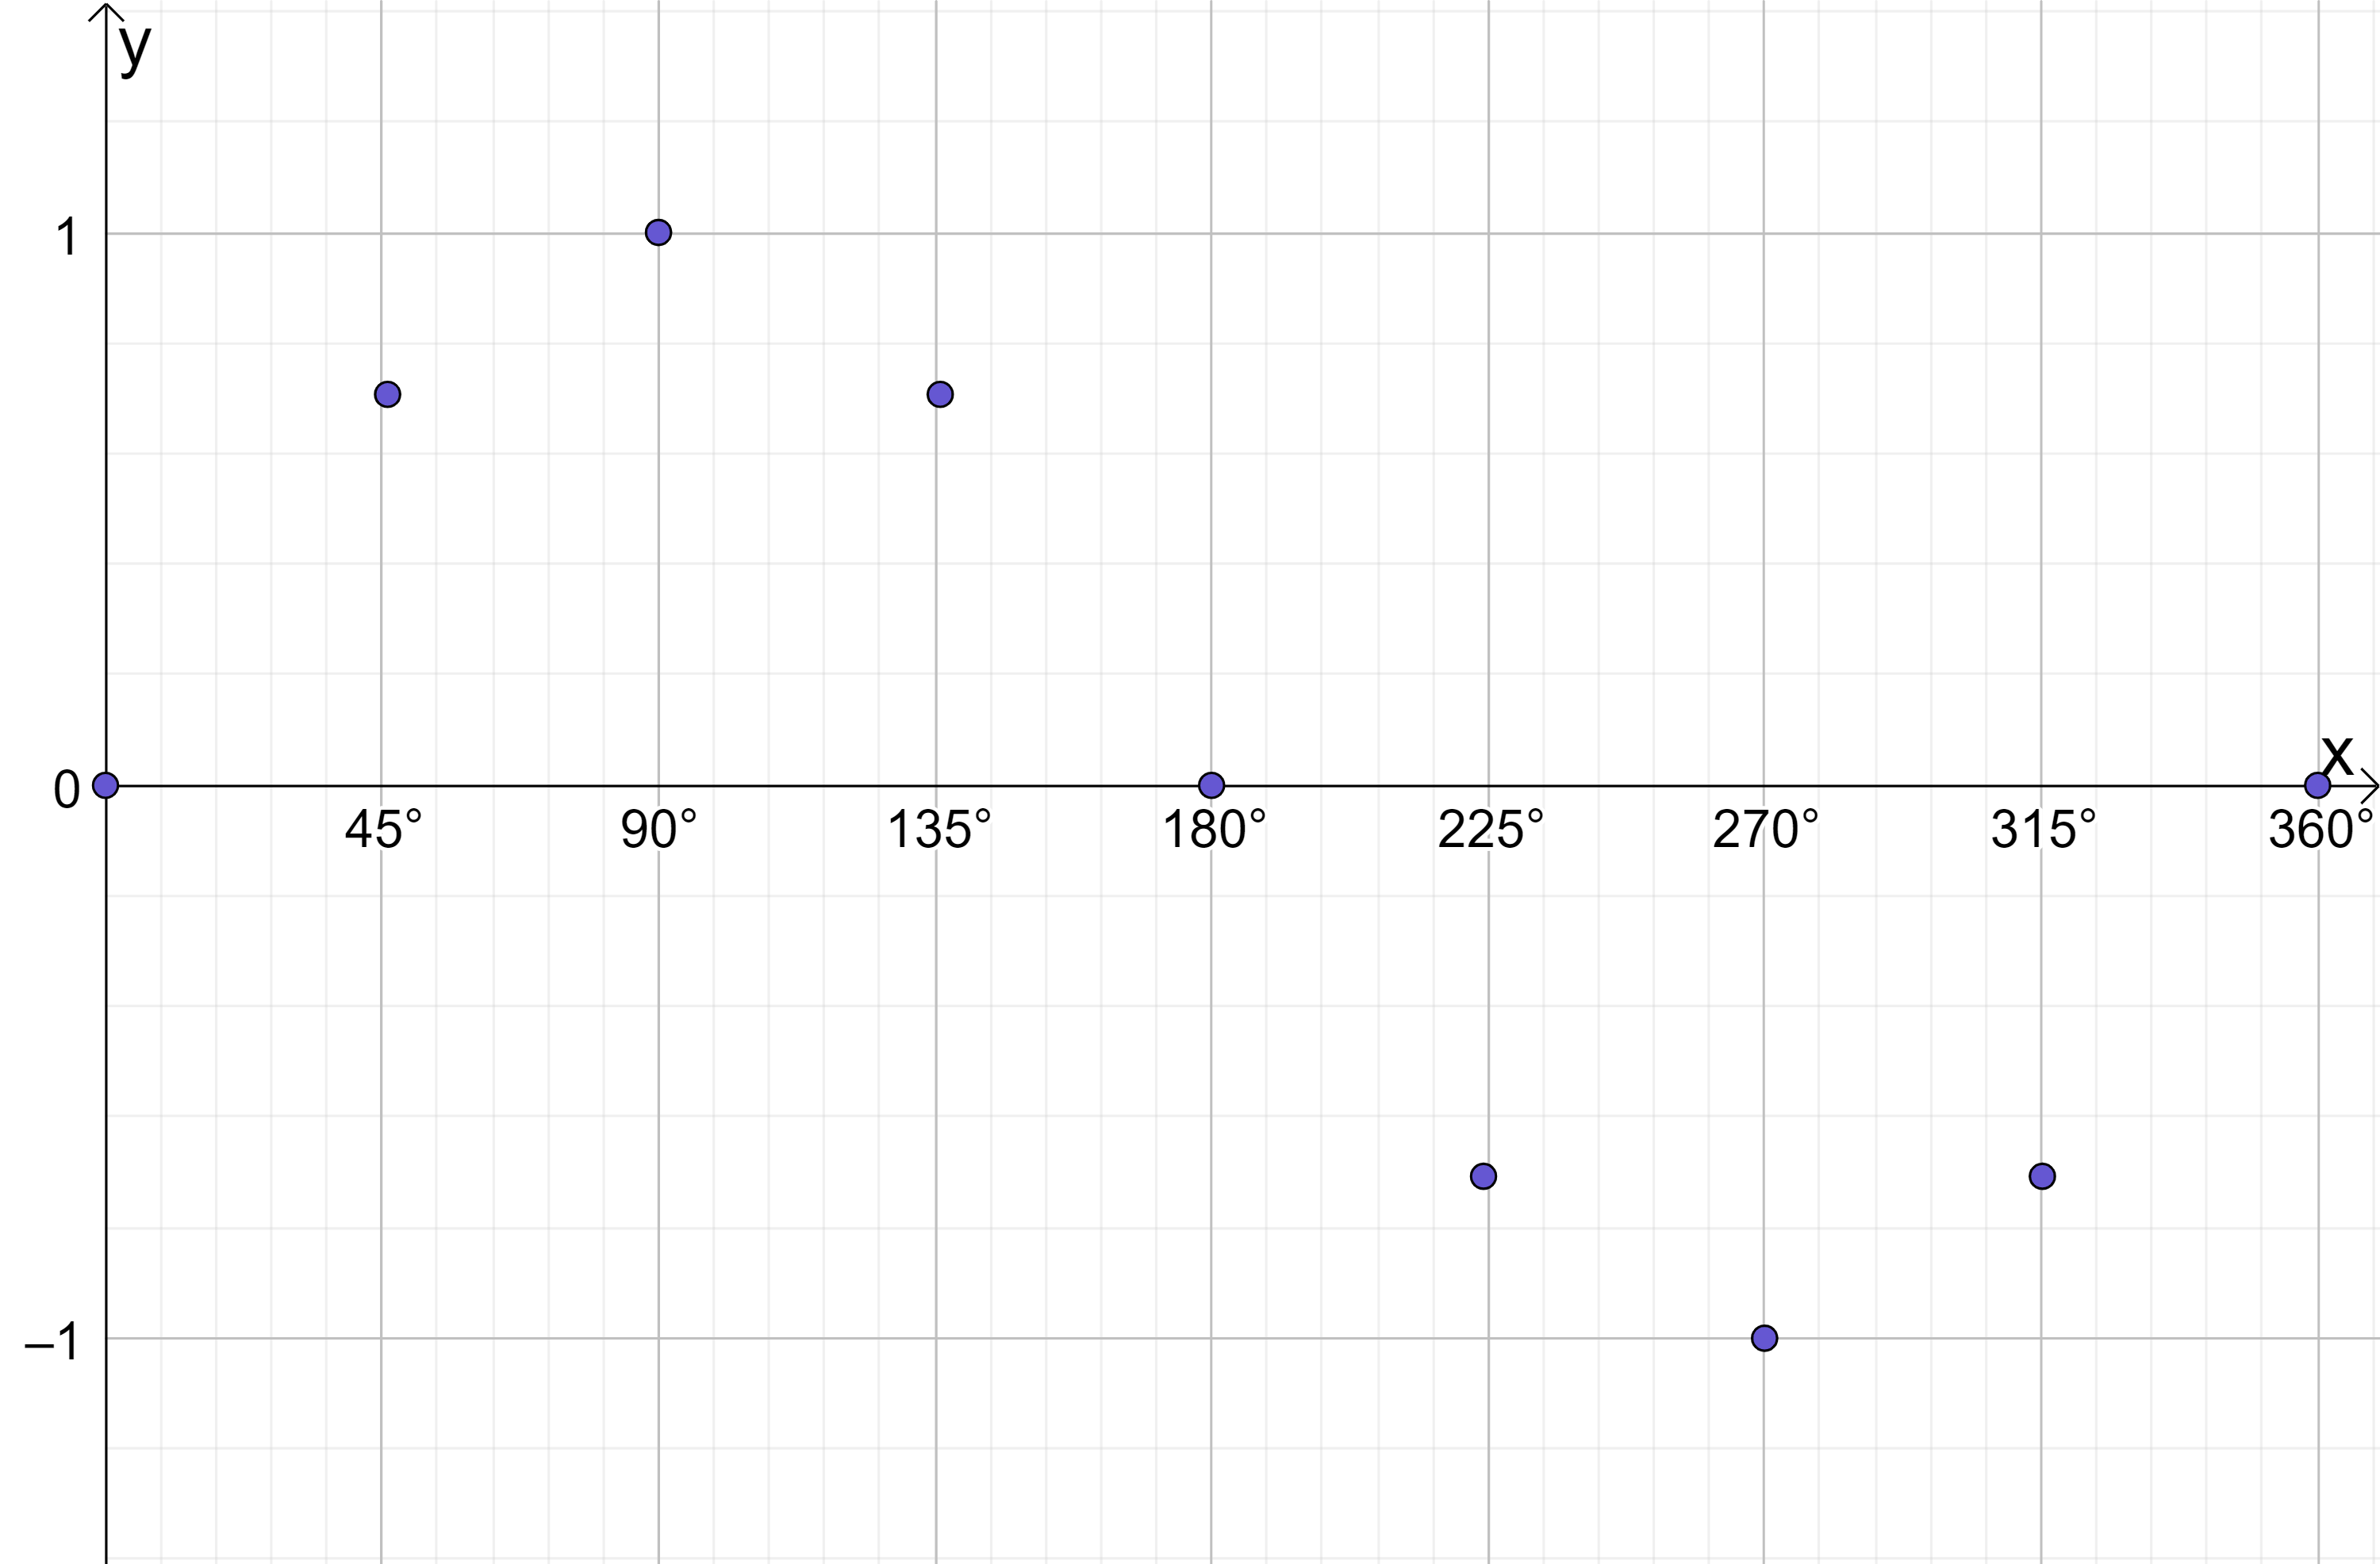
Can you see the graph beginning to take shape? We’ve only plotted 9 coordinates so far, but already we can see this is definitely very different to the other types of functions we have met up till now (which have been either straight lines or quadratics). Let’s expand the coordinate table by adding some additional values:
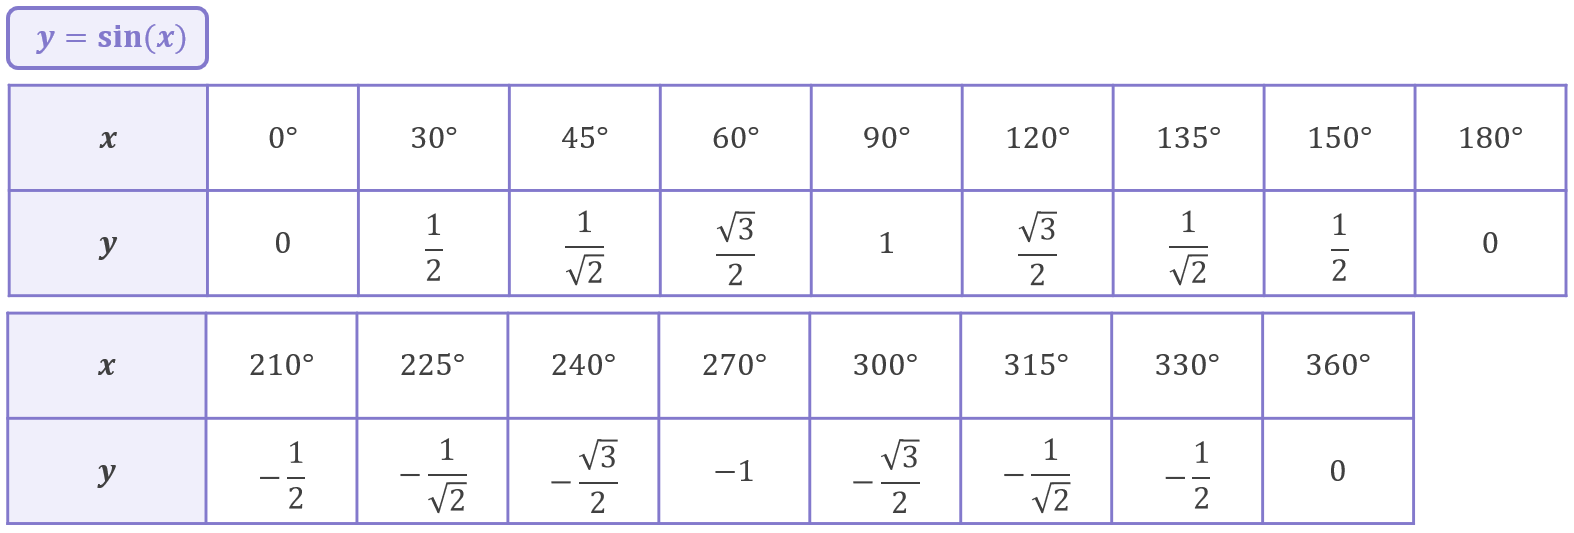
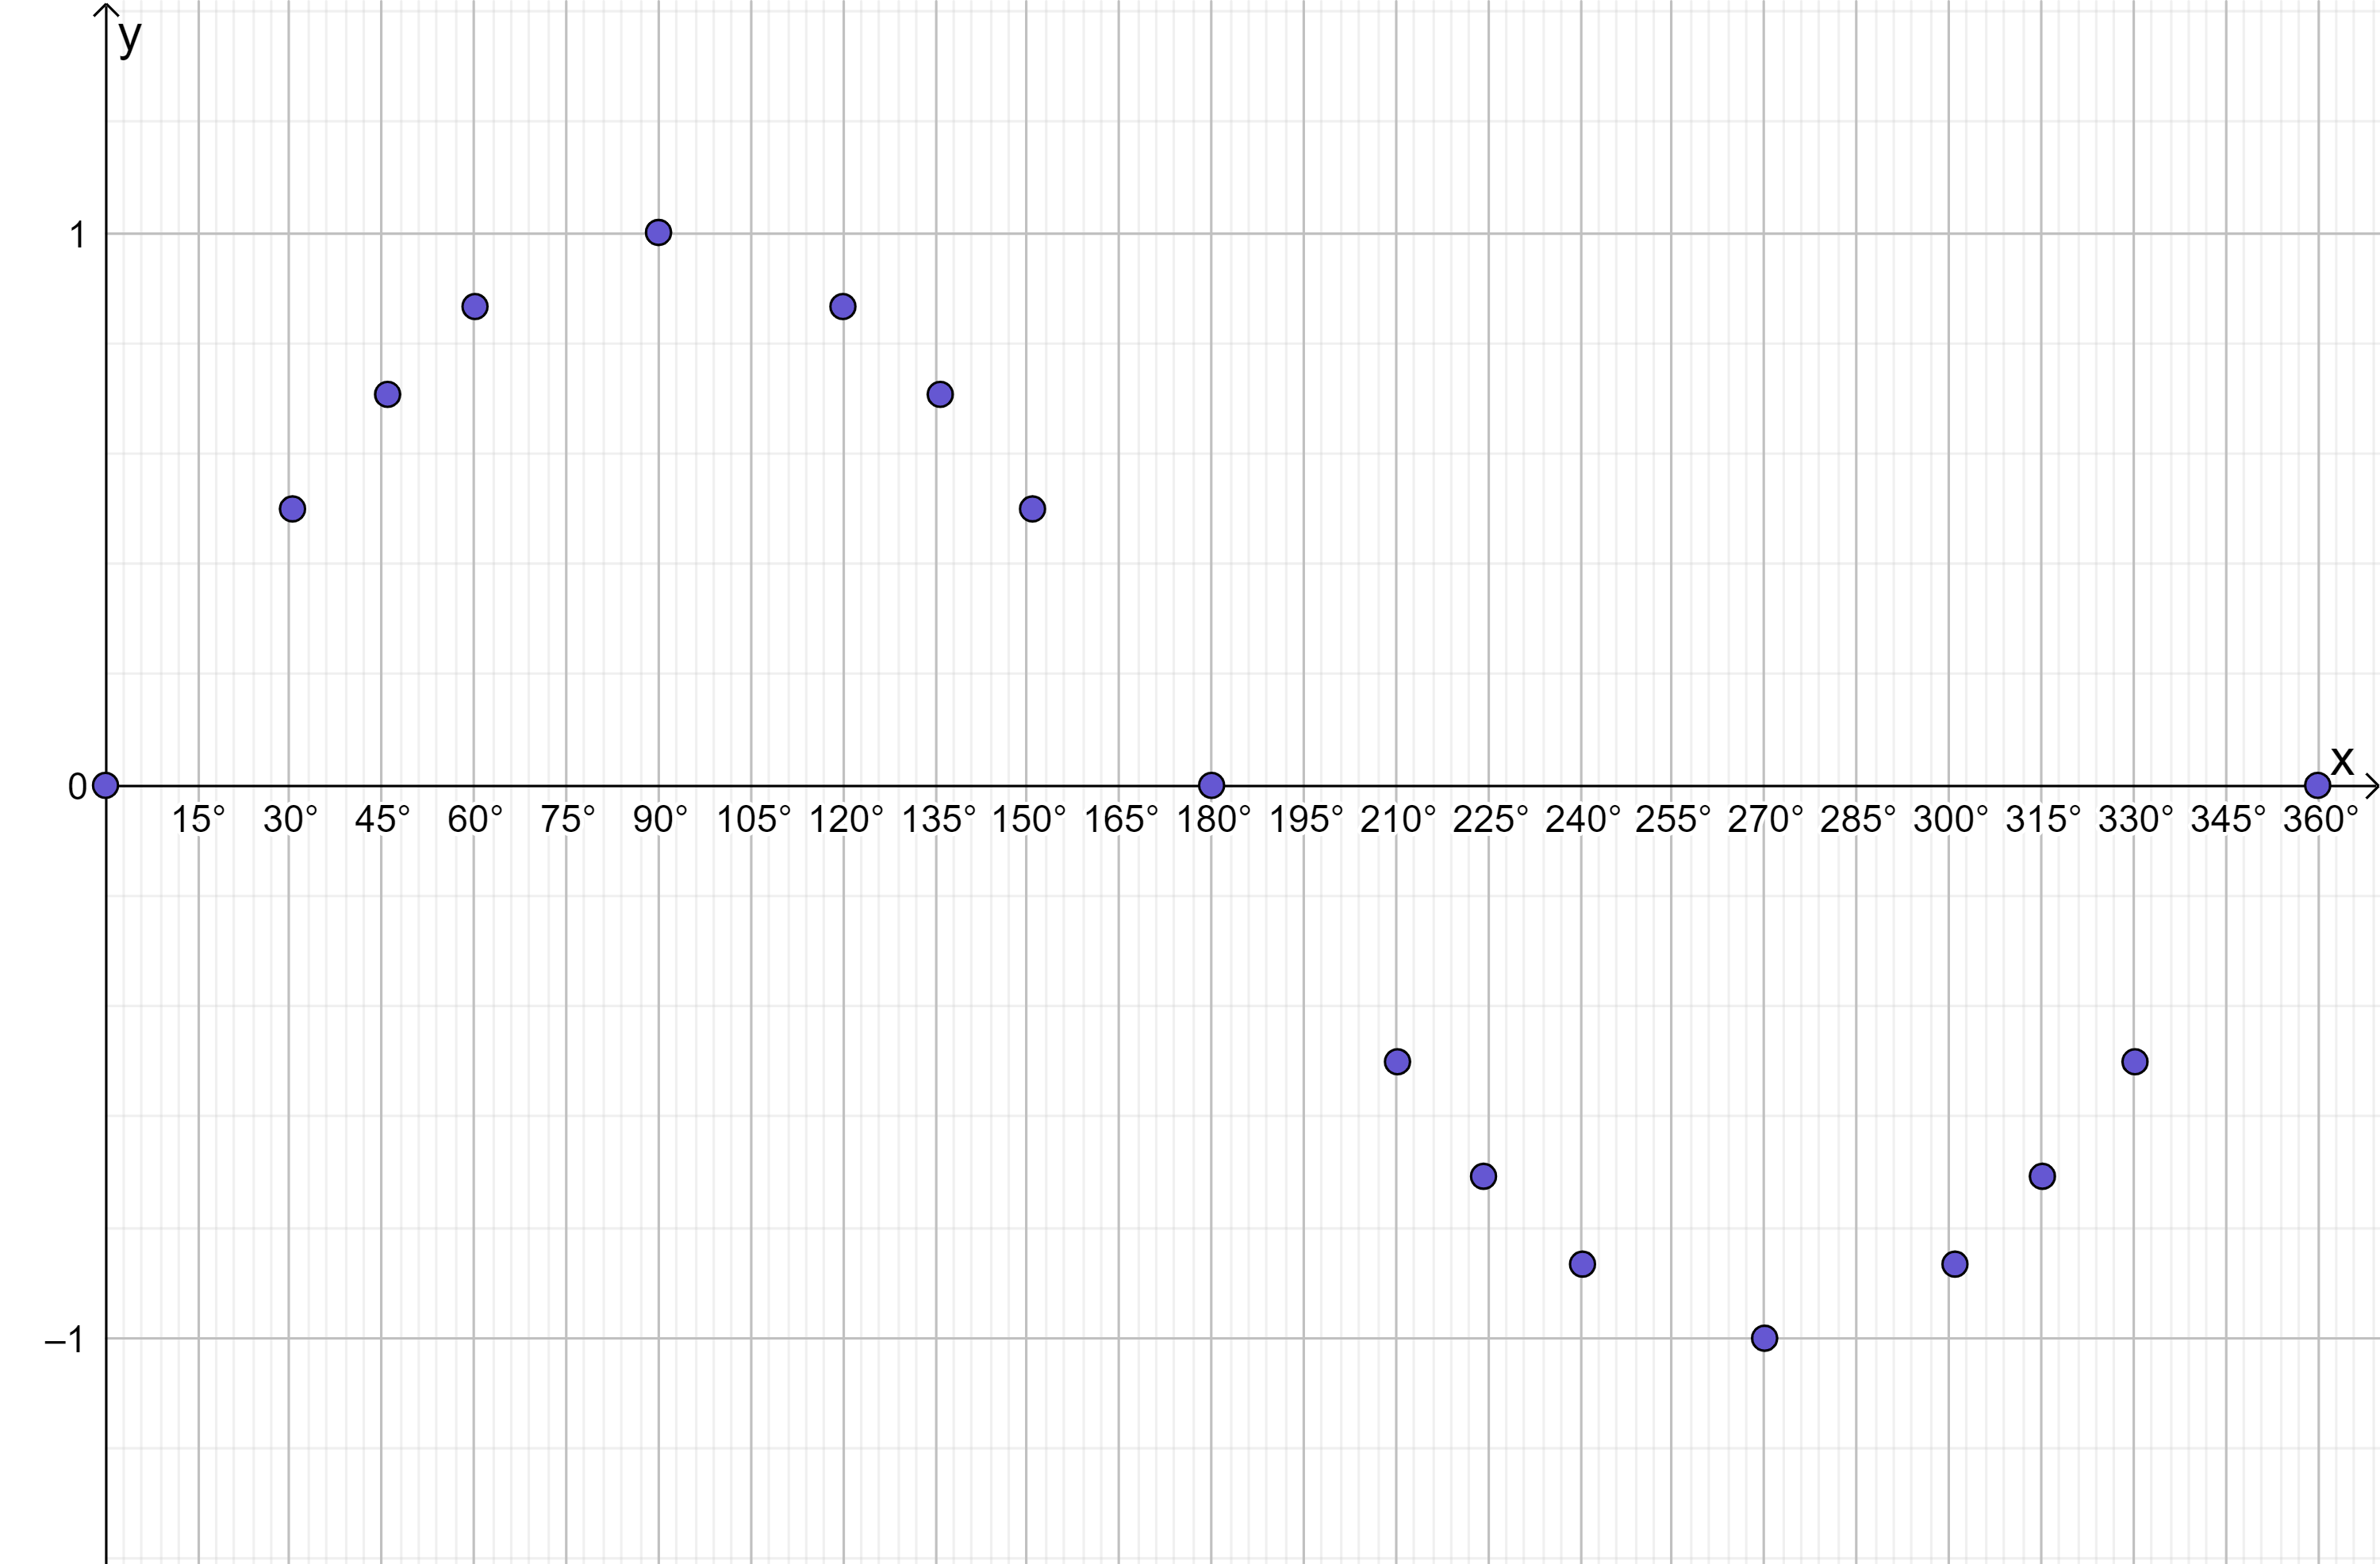
Hopefully now the shape of this function is becoming quite apparent – it is a wave! Plotting each point for all the x values from 0^\circ, 1^\circ, 2^\circ... 359^\circ, 360^\circ produces the smooth wave below:
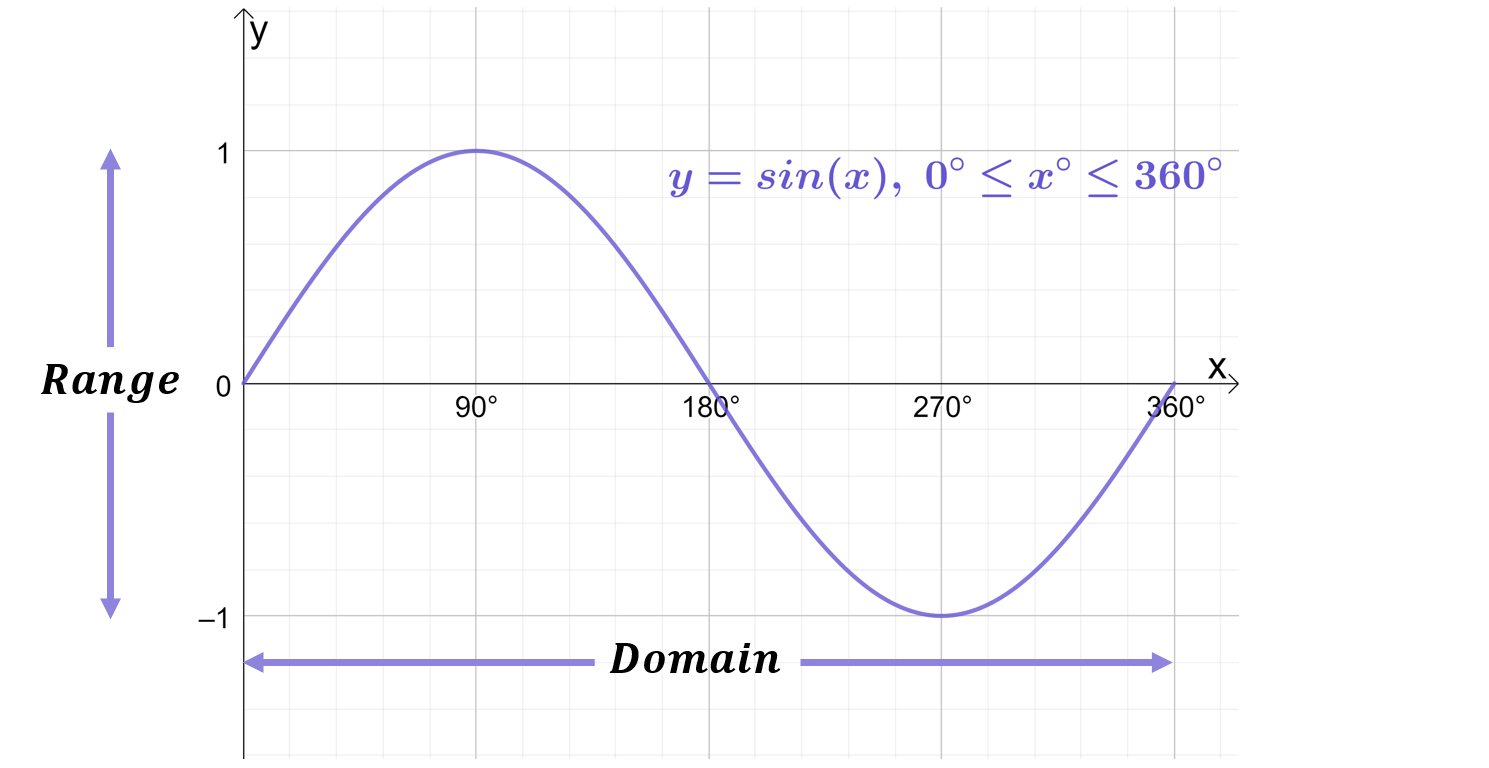
This is the basic graph of y=\sin{x} on the domain 0^\circ\leq x\leq360^\circ. Recall that the domain defines the set of all permitted \boldsymbol{x} values for a particular function. In this case, for this y=\sin{x} function the domain has been specified as 0^\circ\leq x\leq360^\circ which means only x values between 0^\circ and 360^\circ are used. Similar to the domain, which defines the set of all permitted x values, the range is also indicated on the graph, and the range defines the set of all permitted \boldsymbol{y} values, which in the case of y=\sin{x} is -1\leq y\leq1 (meaning y never goes lower than -1 or higher than 1).
As this is the first wave function you have met, it’s important to introduce a few further concepts:
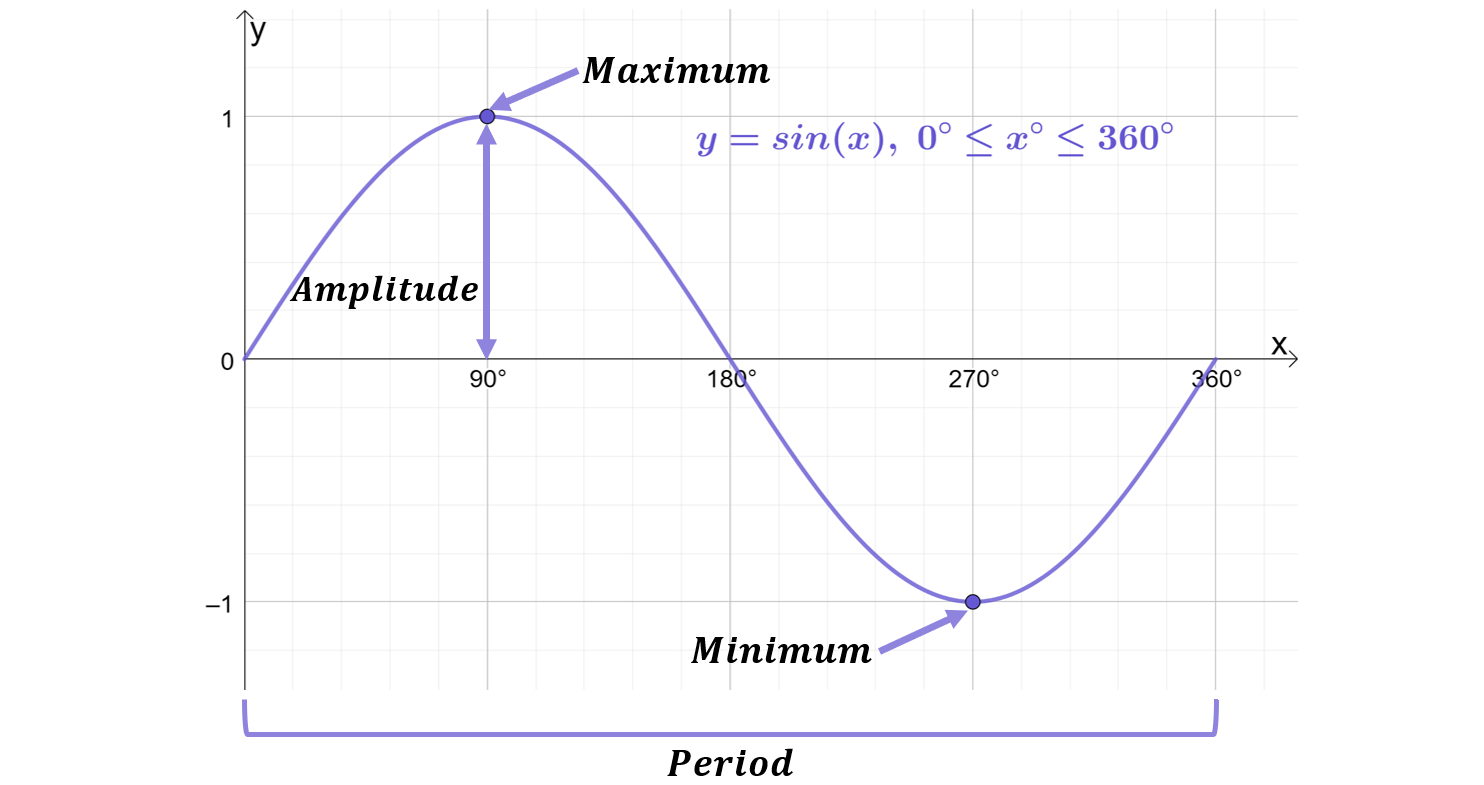
- The amplitude is the vertical distance between a maximum or a minimum and the equilibrium point (the “equilibrium point” is just the x-axis).
y=\sin{x} has an amplitude of 1
- The period is the is the horizontal distance (in degrees) from one maximum to the next (or from any point to the next matching point) of a periodic function. In other words, the period is the length of one full cycle of the wave (measured in degrees). (Note, for those of you who study physics, the definition of period gets a bit more technical in physics, so don’t be confused!)
y=\sin{x} has a period of \boldsymbol{360^\circ}
- The maximum is the point at which the function’s value is greatest.
y=\sin{x} has a maximum of 1 located at the coordinate (90^\circ, 1)
- The minimum is the point at which the function’s value is lowest.
y=\sin{x} has a minimum of -1 located at the coordinate (270^\circ, -1)
Performing a very similar coordinates exercise with the functions y=\cos{x} and y=\tan{x} and plotting the results would produce the following (very different) graphs of the 3 basic trigonometric functions:
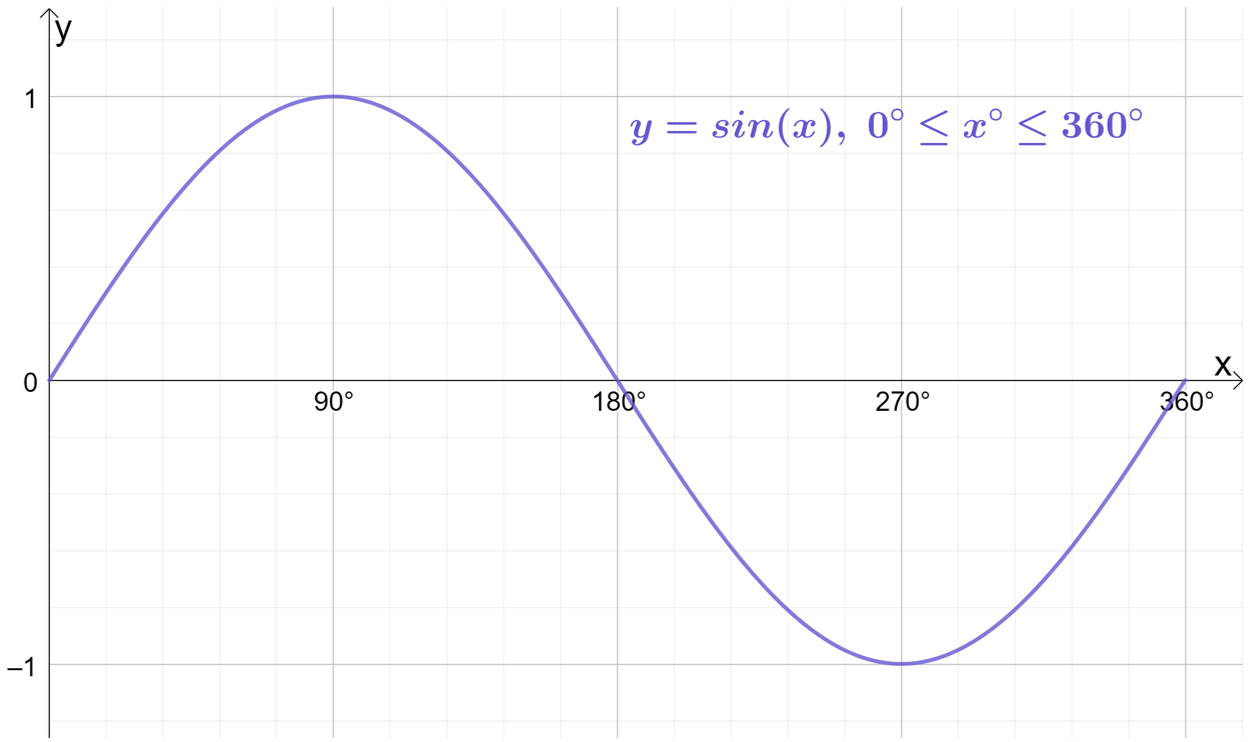
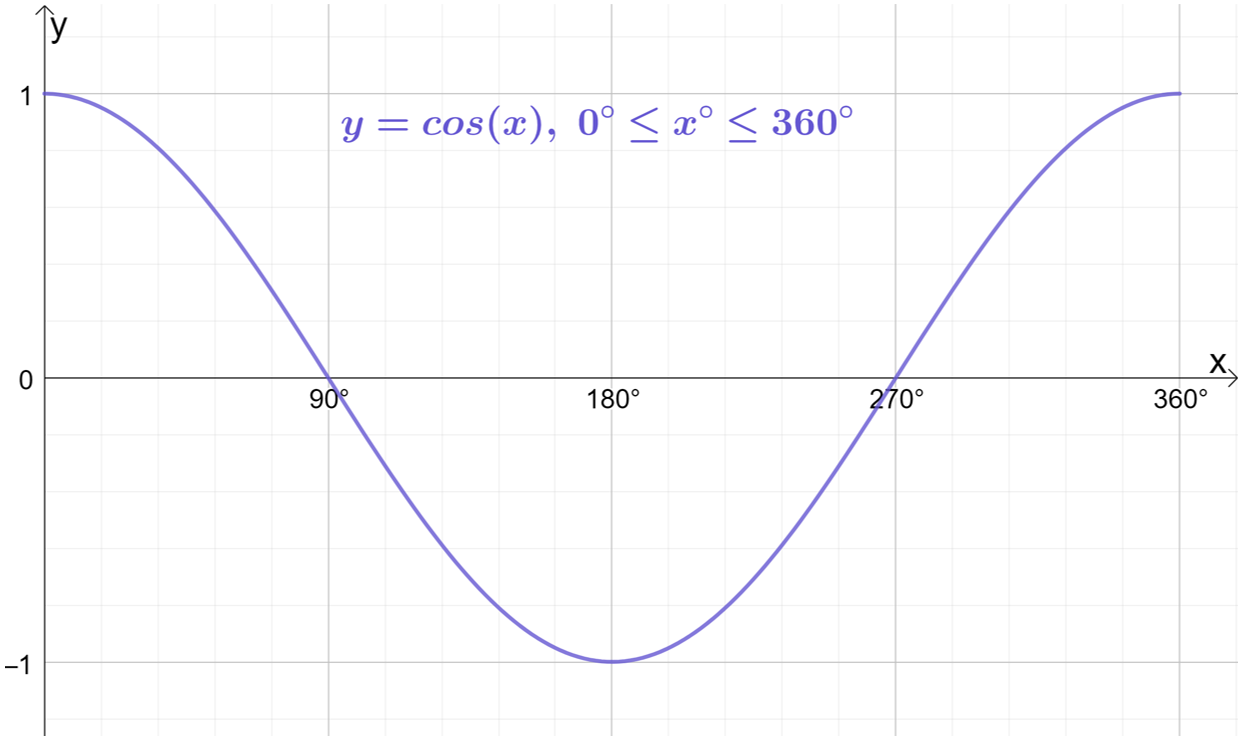

When someone generally references the “graph of y=\sin{x}, y=\cos{x} or y=\tan{x}” without further details, the 3 graphs above are the graphs they are referring to.
Don’t worry if the features of these graphs (particularly the graph of y=\tan{x}) don’t make much sense to you right now – we will discuss the features of each graph in more detail in the next topic.
All of the functions above have been sketched on the same domain of 0^\circ\leq x\leq360^\circ. But \sin{x}, \cos{x} and \tan{x} are periodic functions (functions which repeat values in regular intervals or periods), so by extending the domain wider than 0^\circ\leq x\leq360^\circ (by using x values lower than 0^\circ and higher than 360^\circ) we start to see these waves repeating themselves.
Sketching \sin{x}, \cos{x} and \tan{x} on the wider domain of -360^\circ\leq x\leq360^\circ produces the following graphs:
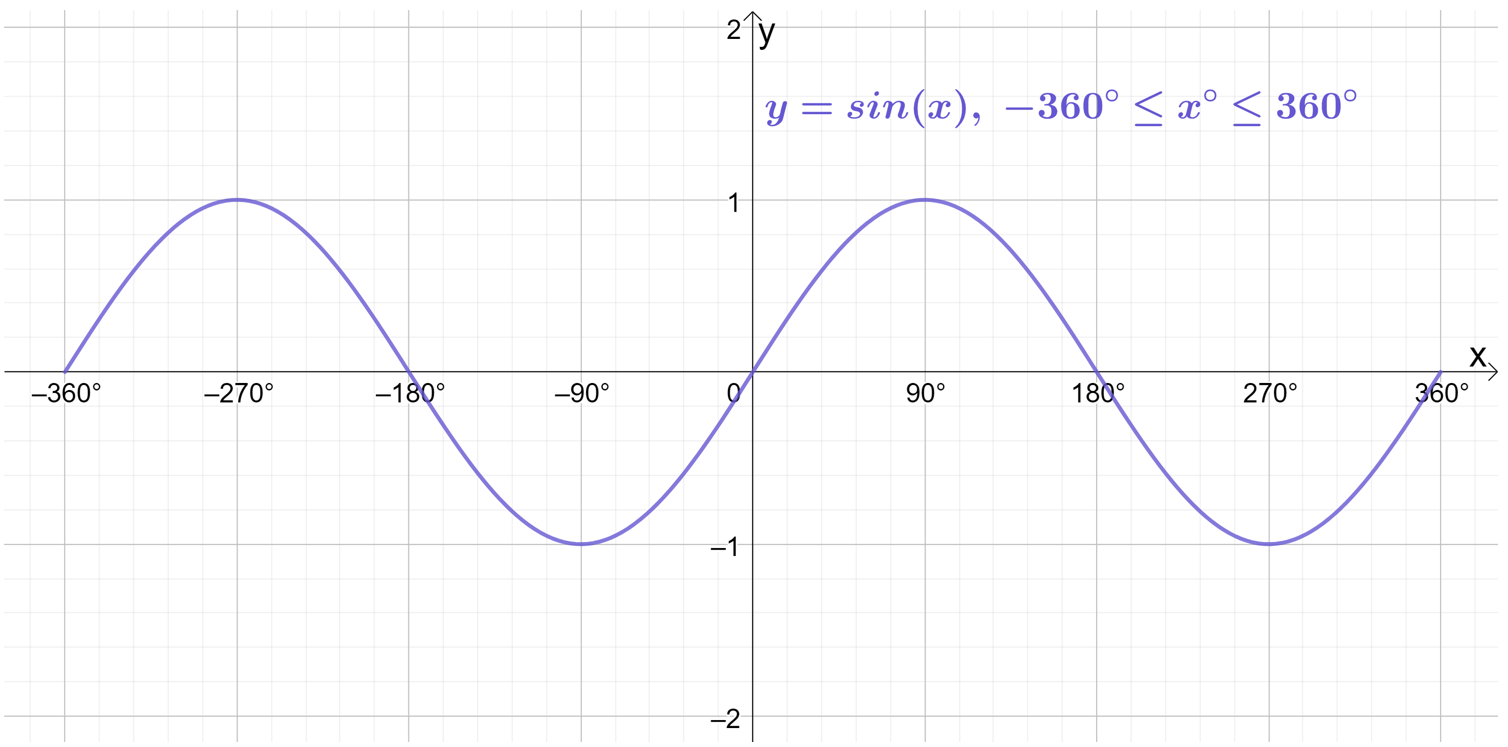
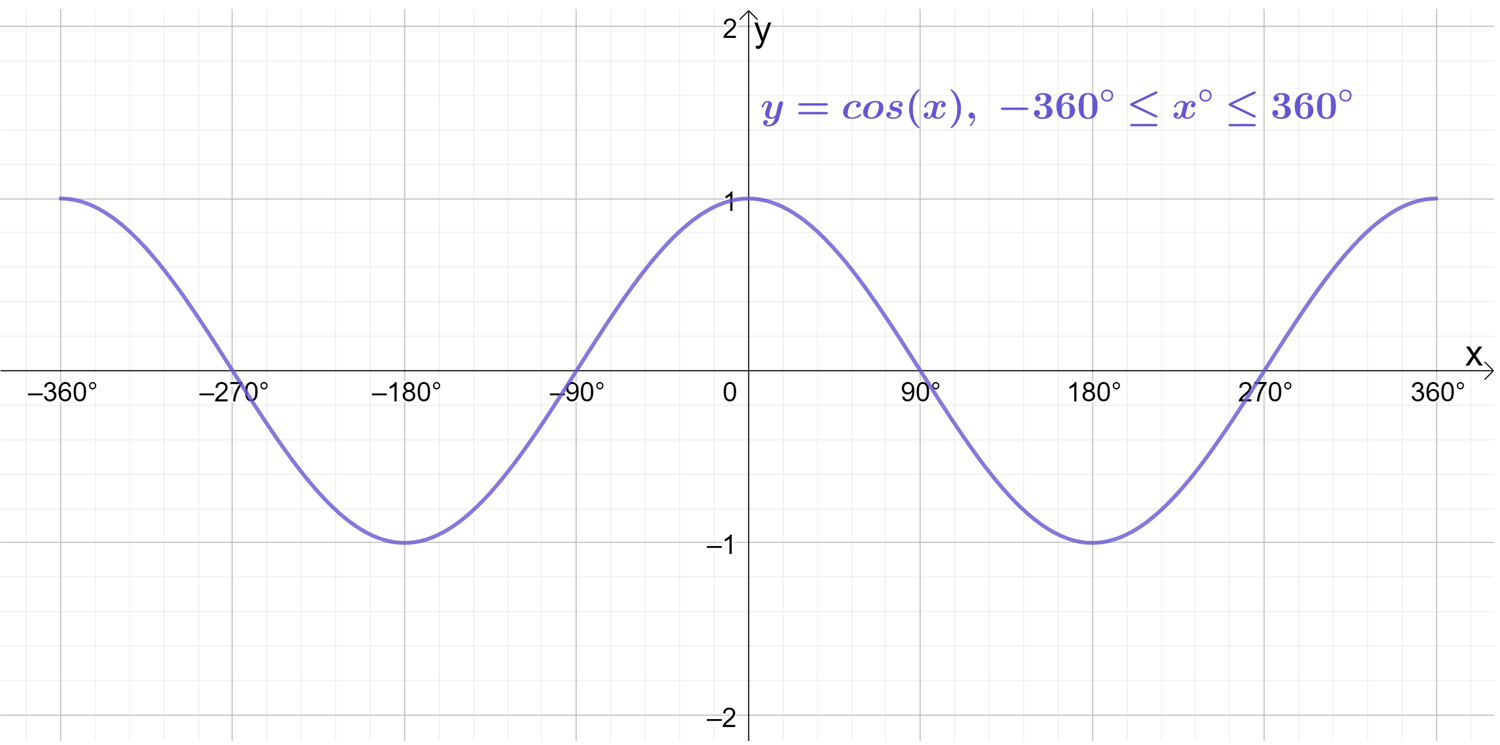
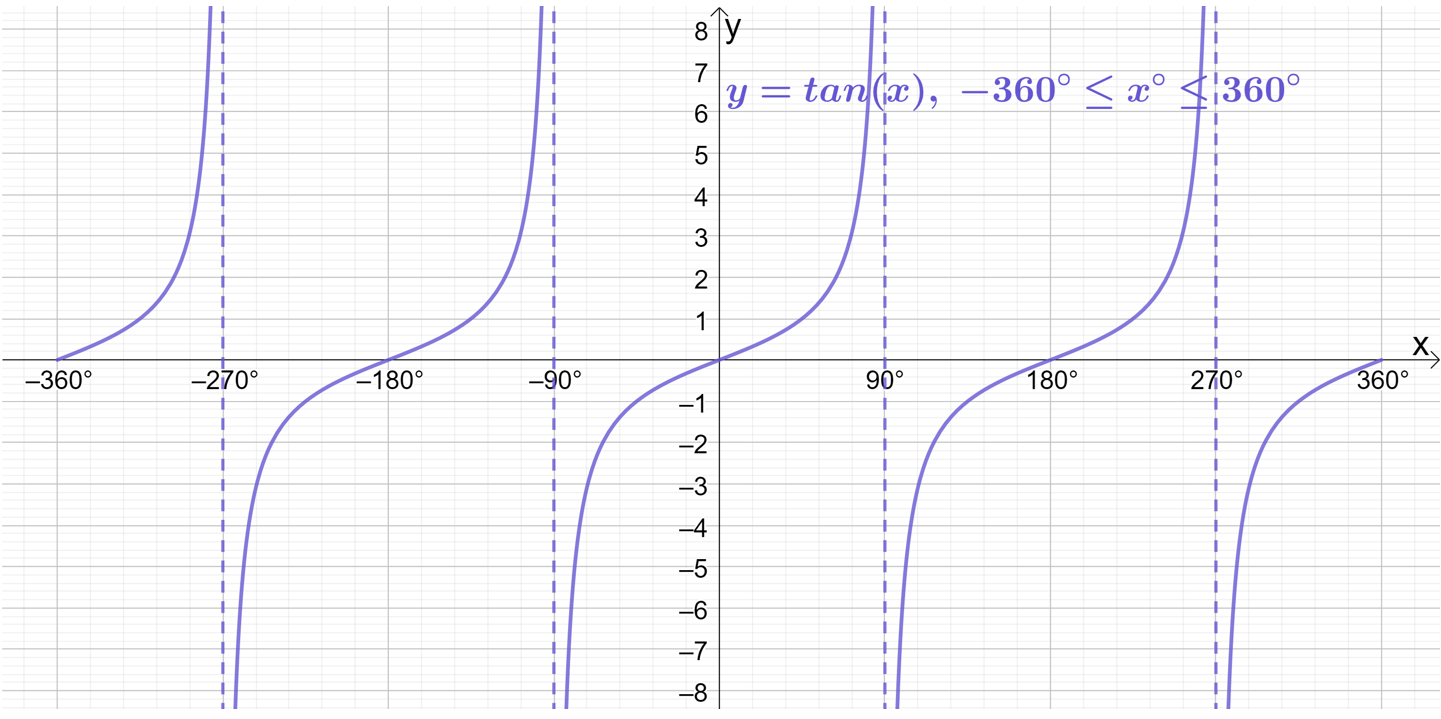
The \boldsymbol{\sin{x}}, \boldsymbol{\cos{x}} and \boldsymbol{\tan{x}} waves extend forever in both positive and negative directions. Now clearly it is impossible to actually draw that (you’d need an impossibly large sheet of paper!), so you’re only every drawing a small part of the \sin{x}, \cos{x} and \tan{x} waves. The domain basically dictates the small part, or “snapshot”, of a wave that you are being asked to show.
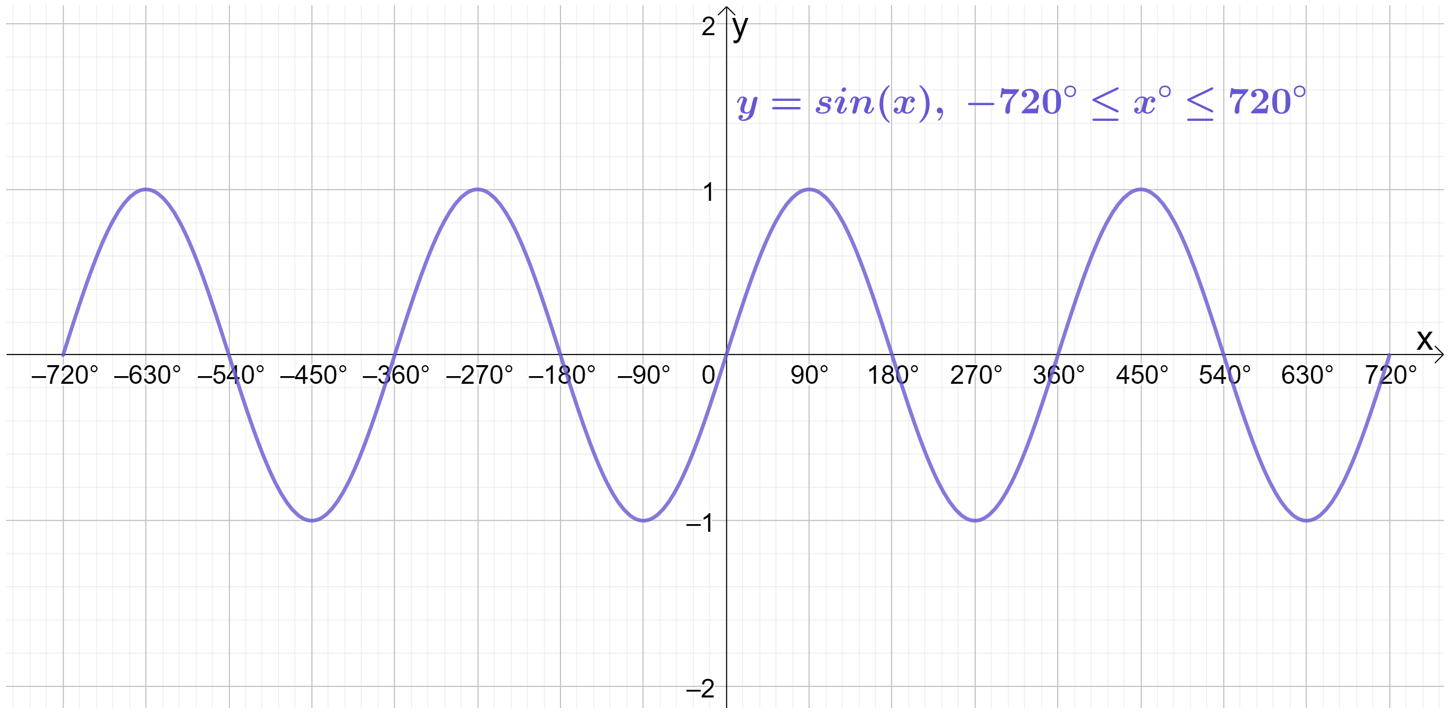
So, if we just keep extending the domain further and further, it will produce more and more repetitions of the waves! Sketching \sin{x}, \cos{x} and \tan{x} on the even wider domain of -720^\circ\leq x\leq720^\circ gives:
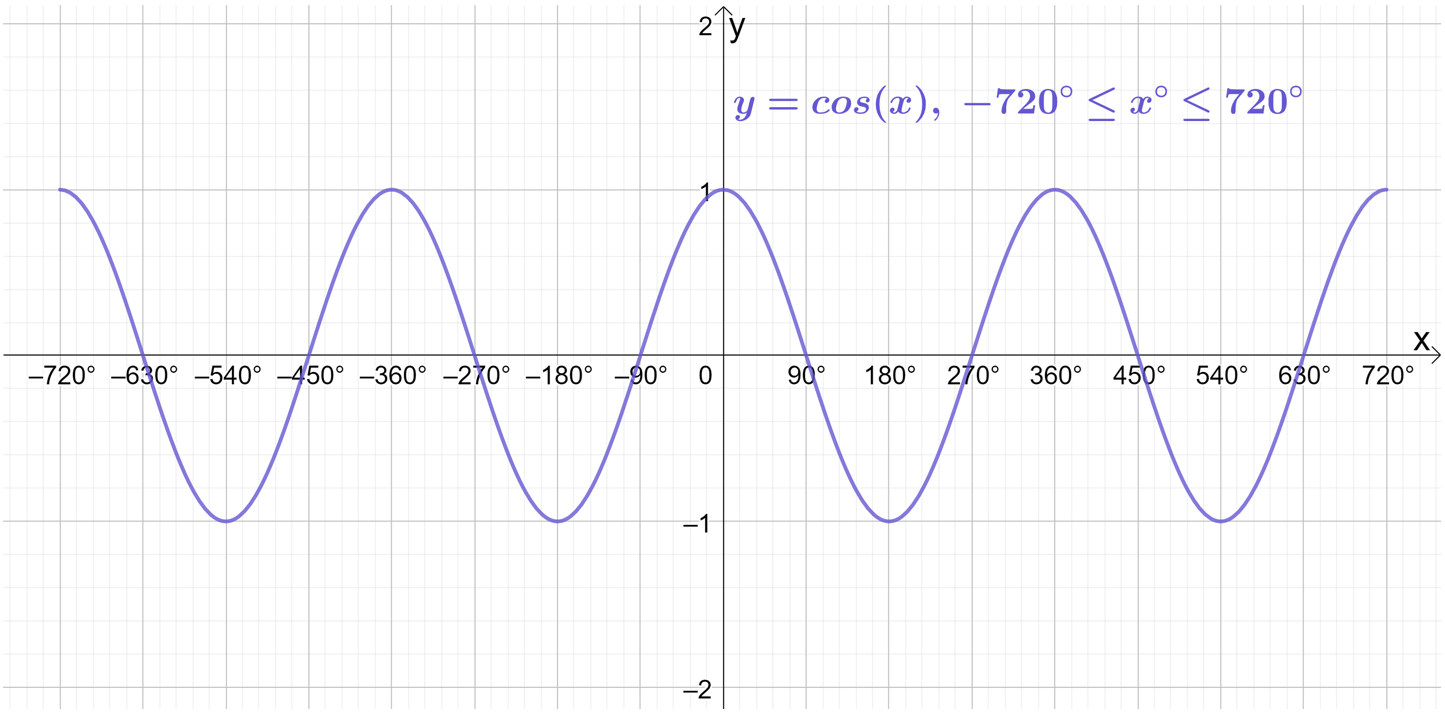
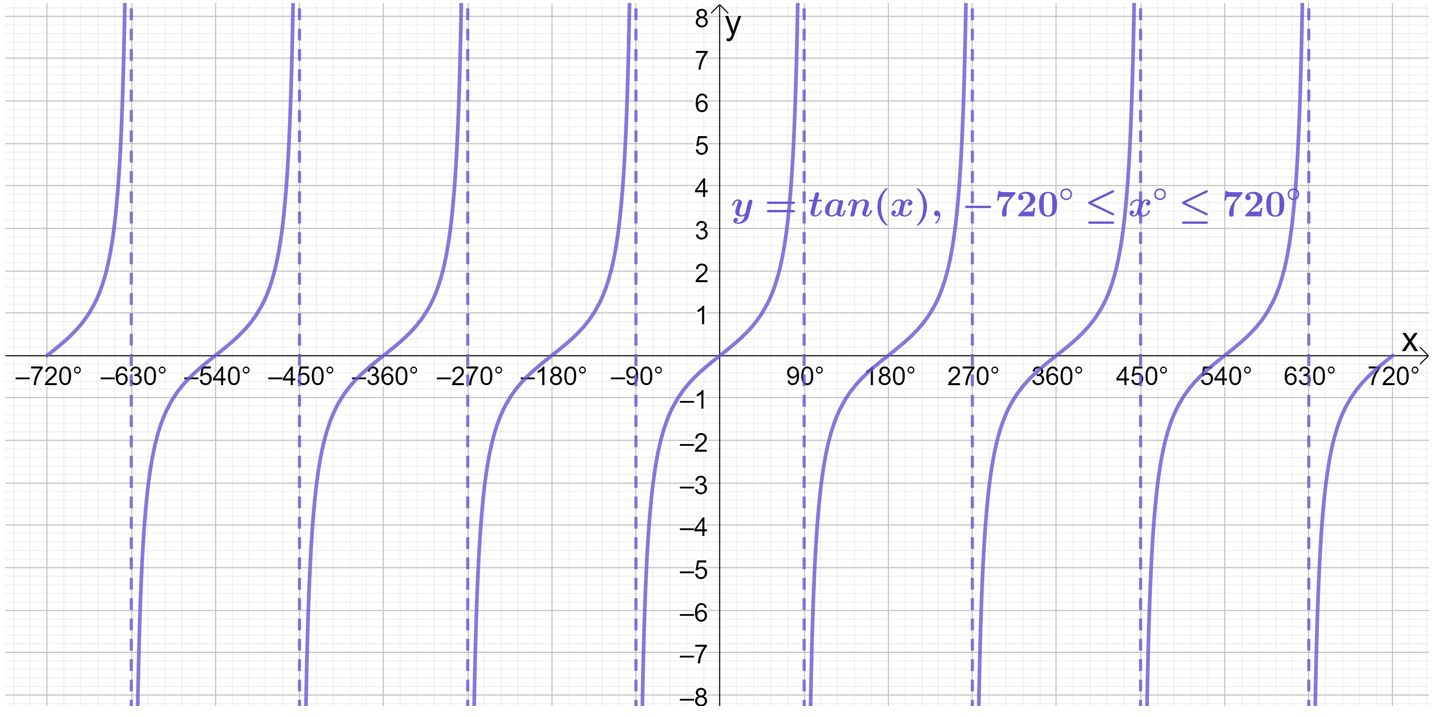
Going one further, if we extend the domain to -1080^\circ\leq x\leq1080^\circ (i.e. a further 360^\circ in both directions), we see even more complete waves:
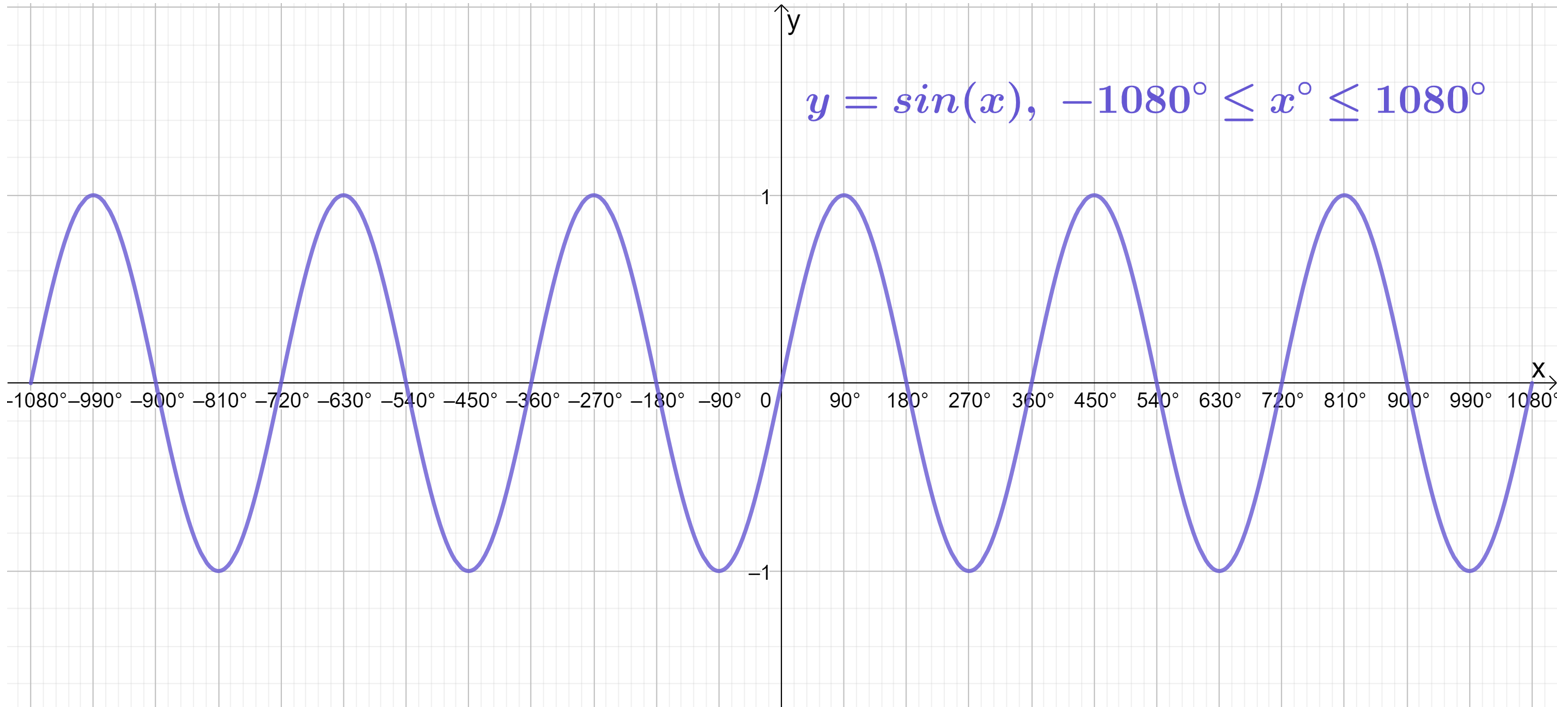
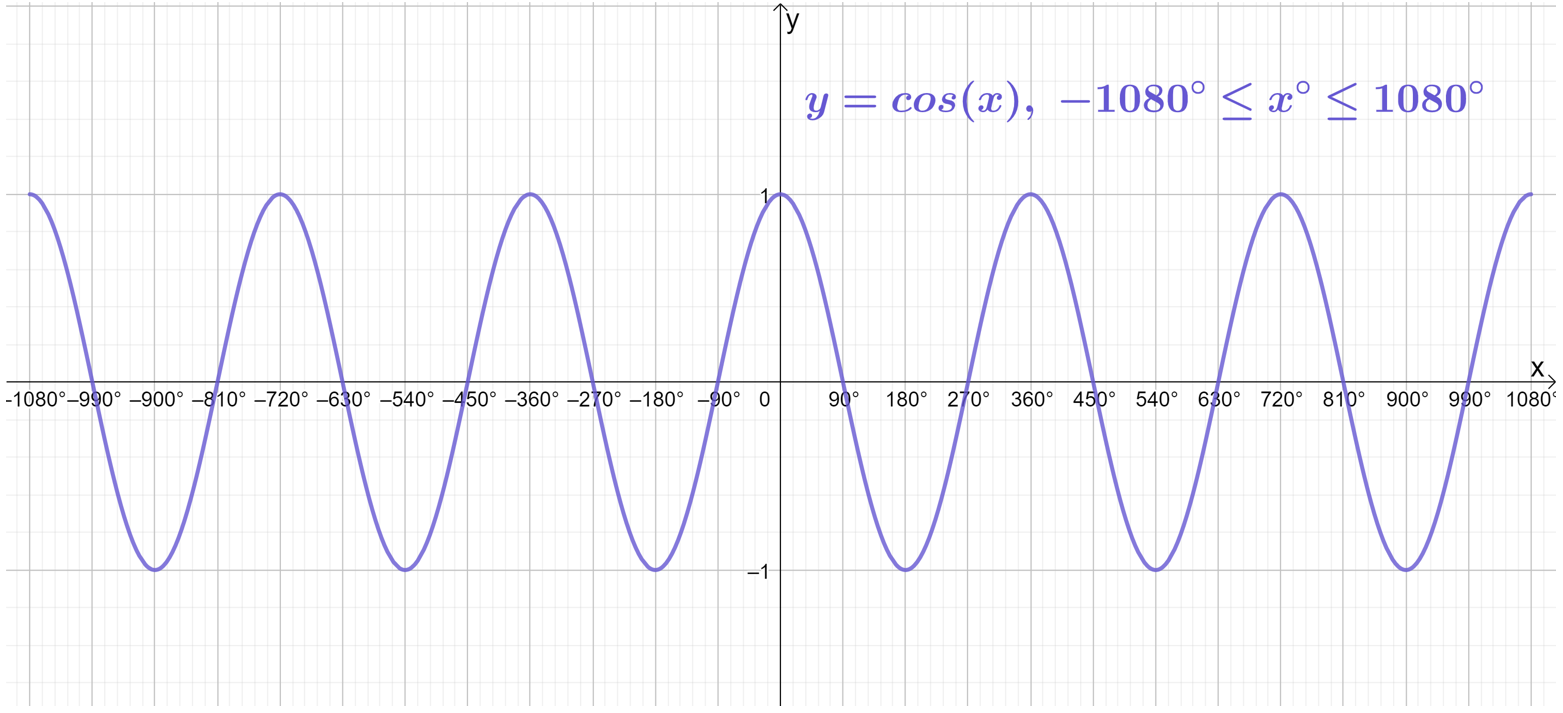
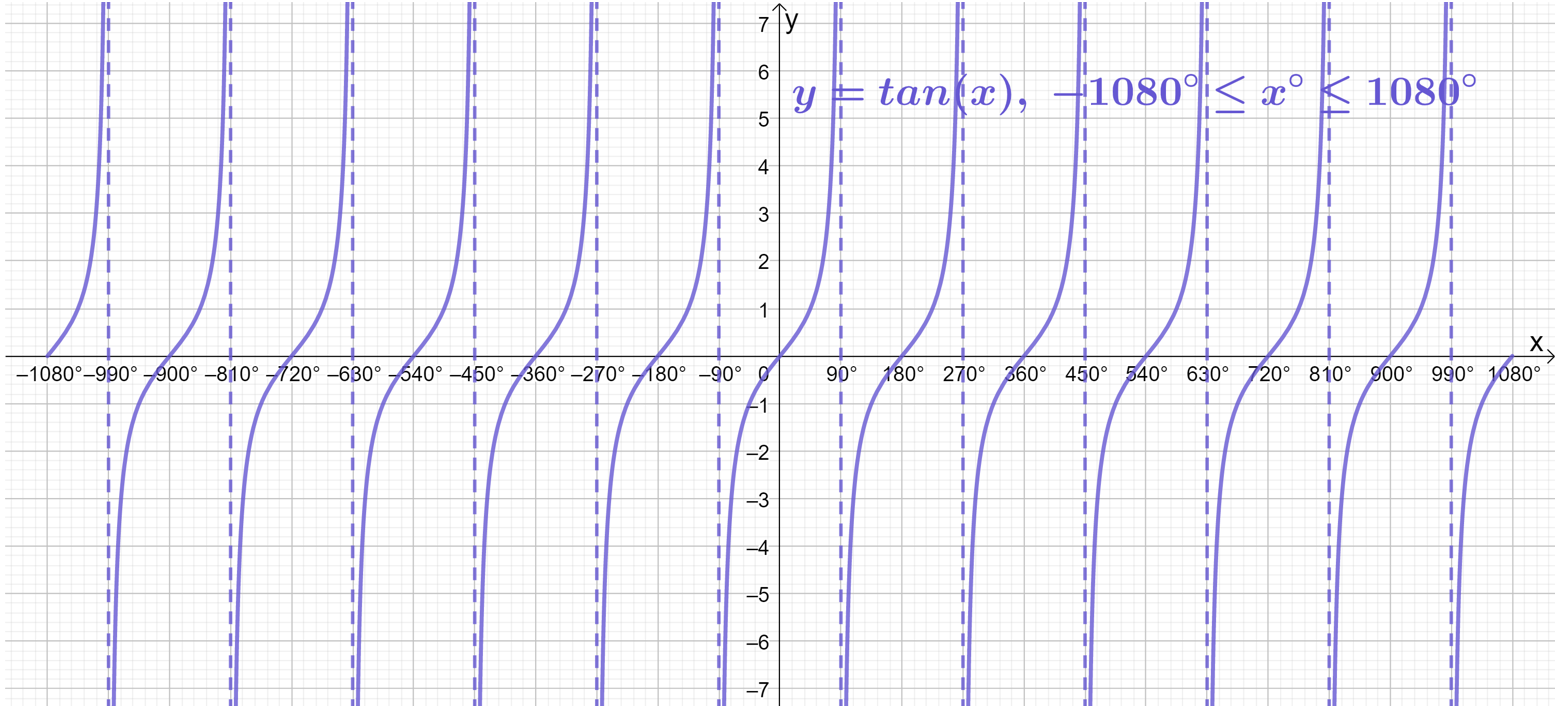
We could continue adding more and more waves in this manner forever, but I think you get the picture!
Key Outcomes
The \sin{}, \cos{} and \tan{} functions define relationships between the sides and the angles of right-angled triangles:
\begin{aligned}\sin{x}&=\frac{opposite}{hypotenuse} \\[12pt]\cos{x}&=\frac{adjacent}{hypotenuse} \\[12pt]\tan{x}&=\frac{opposite}{adjacent}\end{aligned}
Using these functions, as long as you know either:
– One side and one angle; or
– Two sides
You will always be able be able to calculate the lengths of the other missing sides or angles.
The SOH CAH TOA triangles are useful tools to help you decide which trigonometric function (i.e. \sin{}, \cos{} or \tan{}) you should be using in a given situation:

The domain of a function defines the set of all permitted x values. Think of this as a “snapshot” of a small part of a function that you are being asked to show. Similarly, the range defines the set of all permitted y values.
The \sin{x}, \cos{x} and \tan{x} functions are periodic functions, meaning they begin to repeat themselves if you extend the domain.
The \sin{x}, \cos{x} and \tan{x} graphs are often shown as standard on a domain of 0^\circ to 360^\circ. If you extend the domain wider than this, you will begin to see more cycles of the waves.
The \sin{x}, \cos{x} and \tan{x} functions are waves. All waves have an amplitude, period, maximum and minimum.
The amplitude is the vertical distance between a maximum or a minimum and the equilibrium point (the “equilibrium point is just the x-axis).
The period is the distance (in degrees) from one maximum to the next (or from any point to the next matching point) of a periodic function. In other words, the period is the length of one full cycle of the wave (measured in degrees).
The maximum is the point at which the function’s value is greatest.
The minimum is the point at which the function’s value is lowest.