What is Standard Deviation?
In statistics, standard deviation is the most common measure of dispersion, or how “spread out” data is around the mean.
Let me explain.
Imagine two classes – Class A and Class B – sit their National 5 Maths prelim. Each class has 10 students. Their results were as follows:


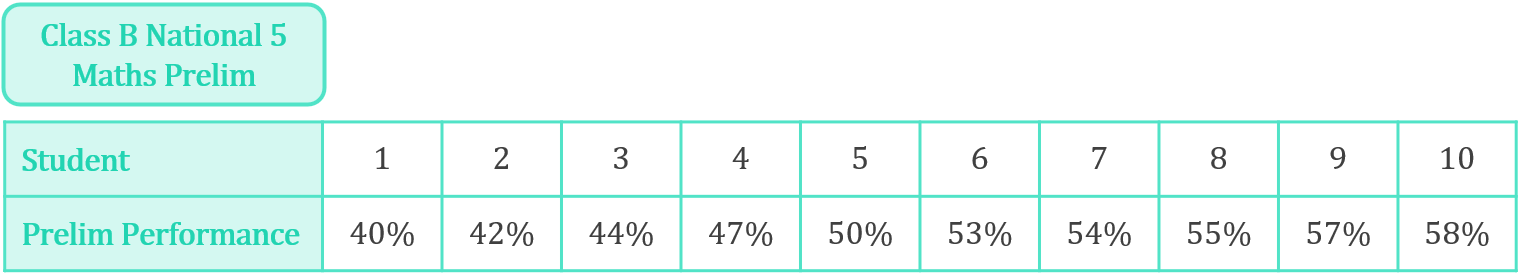
The results for each class are noticeably different – Class B’s results are quite closely packed together with all results falling within a narrow range between 40%-58%, whereas Class A’s results are spread out over a much wider range. However, if we compare the mean results for each class:
\begin{aligned}&Class A Mean=\frac{Sum of Class A Results}{Number of Class A Results} \\[16pt]&Class A Mean=\frac{3+8+16+28+44+55+77+80+91+98}{10} \\[12pt]&Class A Mean=\frac{500}{10} \\[12pt]&Class A Mean=50\%\end{aligned}
\begin{aligned}&Class B Mean=\frac{Sum of Class B Results}{Number of Class B Results} \\[16pt]&Class B Mean=\frac{40+42+44+47+50+53+54+55+57+58}{10} \\[12pt]&Class B Mean=\frac{500}{10} \\[12pt]&Class B Mean=50\%\end{aligned}

We see that their means are actually the same. Both classes have an average result of 50% even though the spread of the results in each class is drastically different.
As you learned earlier in this module, the purpose of a mean is to calculate a figure which is representative of a dataset as a whole, or representative of the dataset “on average”. Do you think that 50% is a fair representation of what the average student in each class might score if they were to sit the prelim again?
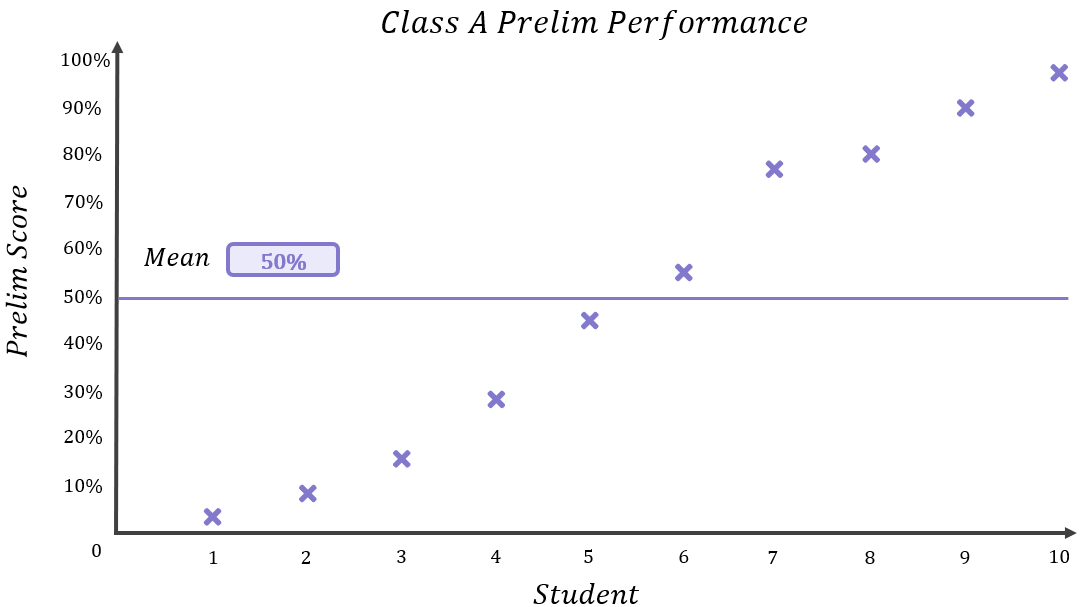
Let’s examine each class again more closely. First, Class A:
Do you think 50% is a fair representation of what the average student in Class A scored? I wouldn’t say so. Only one person scored somewhere in the 50%’s, and the rest were spread over a very wide range.
If you were the student who scored 3% or 8%, you might be quite happy to state that your class average was 50% since this makes you look better, but if you were the student who scored 91% or 98%, I think you’d be quite annoyed to have to state that your class average was 50% since this makes you look worse. In short, the 50% average is not representative of what most of the students in Class A scored – most either scored quite a lot lower or quite a lot higher than this. You could describe the mean of Class A as a “low quality mean” because it does not accurately reflect the performance of the average student.
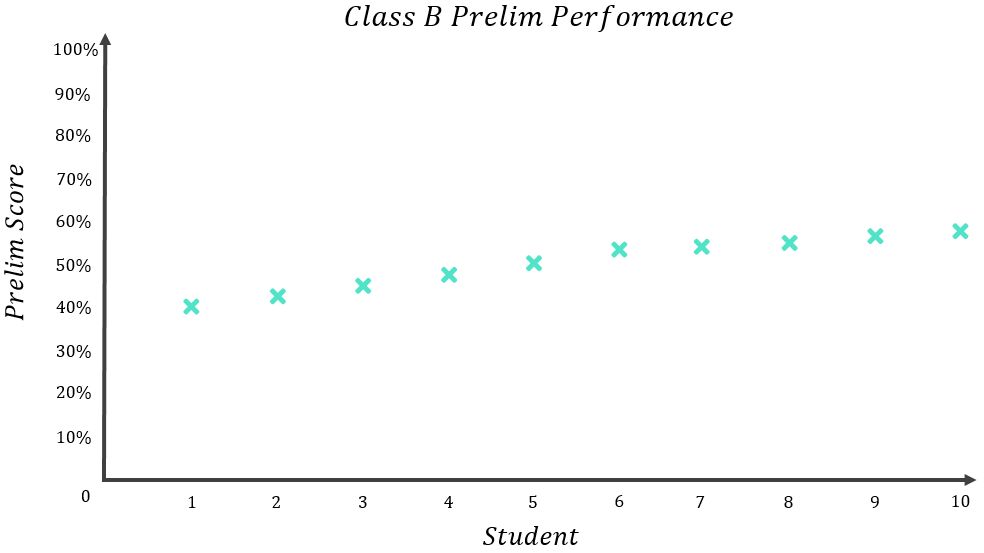
Now looking back at Class B:
Do you think 50% is a fair representation of what the average student in Class B scored? In this case, I would say yes, it is. Nobody really scored massively more or massively less than 50% – the furthest result from the average was the student who scored 40%, and all results fell within a relatively narrow range of 18% (recall: Range=Maximum-Minimum=58\%-40\%=18\%). You could therefore describe the mean of Class B as a “high quality mean” because it accurately reflects the performance of the average student.
We’ve used the terms “low quality” and “high quality” to try and describe how accurately the means of Class A and Class B respectively reflect their students’ performance, but this is mathematics, so we need to get a bit more technical with our descriptions of “quality”.
This is where standard deviation comes in!
You do not yet know how to calculate standard deviation (we discuss this in the next topic), so I will provide the standard deviation for each class below:
Class A Standard Deviation=35.4\%
Class B Standard Deviation=6.4\%
Although Class A and Class B have the same mean result of 50%, they have vastly different standard deviations. This is because Class A’s results are more widely dispersed (i.e. more “spread out”) about the mean than Class B’s results.
A low standard deviation (low dispersion) indicates that the datapoints in a set tend to be close to the mean of the set (like Class B), whereas a high standard deviation (high dispersion) indicates that the datapoints are spread out over a wider range (like Class A).
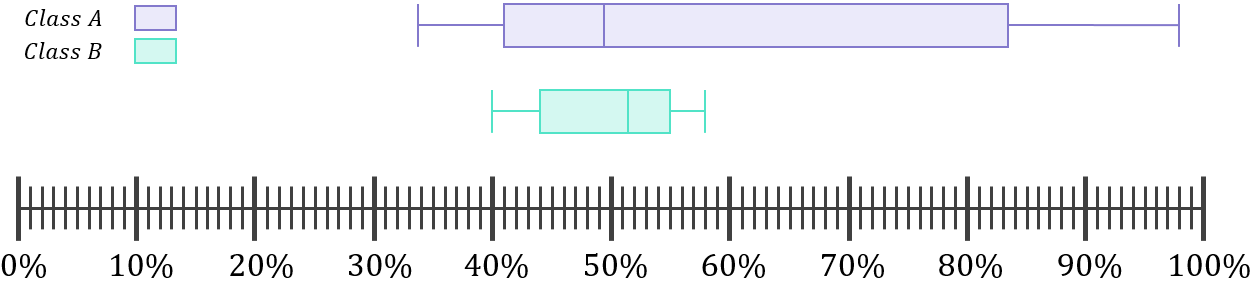
Another way to visualise the difference in the dispersion of the results of each class (i.e. the difference in how spread out they are) is by using boxplots – clearly Class B’s results are packed much more closely together than Class A’s:
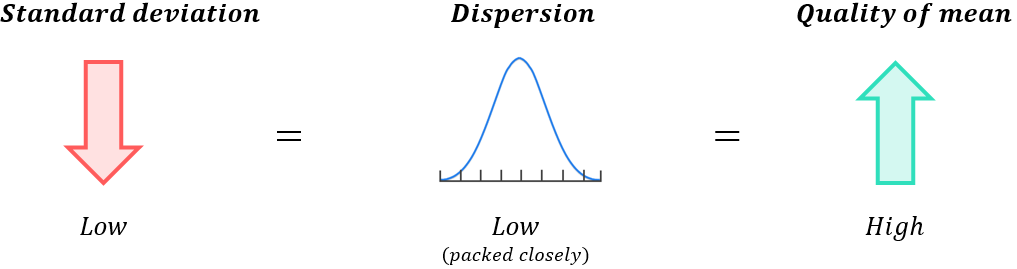
Standard deviation can be a tricky concept to grasp initially, so it is still sometimes useful to think in less technical terms. If you’re ever confused, just think of standard deviation as a measure of the “quality” of a mean value.
A low standard deviation indicates the data is packed closely together (low dispersion); this indicates the mean is high quality and it will reflect the typical datapoint in the set with some accuracy:
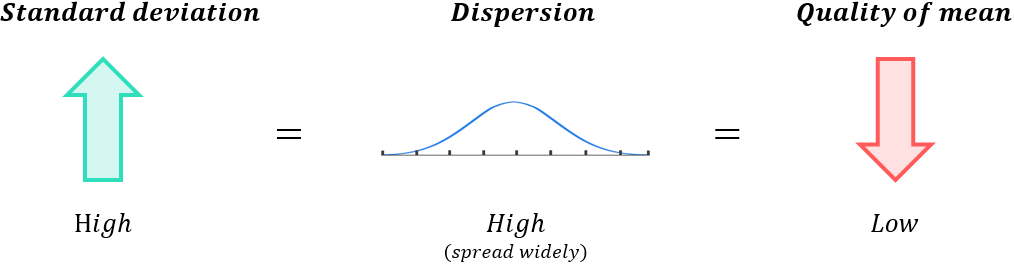
A high standard deviation indicates the data is spread over a wide range (high dispersion); this indicates the mean is low quality and it will not reflect the typical datapoint in the set very accurately:
Key Outcomes
In statistics, standard deviation is the most common measure of dispersion, or how “spread out” data is about the mean.
A low standard deviation (low dispersion) indicates that the datapoints in a set tend to be close to the mean of the set, while a high standard deviation (high dispersion) indicates that the datapoints are spread out over a wider range.