

What is the Median?
The median is an easy concept to understand. Simply:
The median is the middle number in a dataset when it is ordered numerically.
It’s just that easy. Think “median”, think “middle”.
But be careful – that last point is very important. If it is not already in numerical order, your dataset must be sorted into numerical order before calculating the median.
The median is the value separating the upper half from the lower half of a data sample, so if you don’t first order the set numerically, you won’t truly be finding the half way point in the sample.
Let’s take an example. Imagine a class of 9 S4 pupils sit their National 5 Maths prelim and their results were as follows:
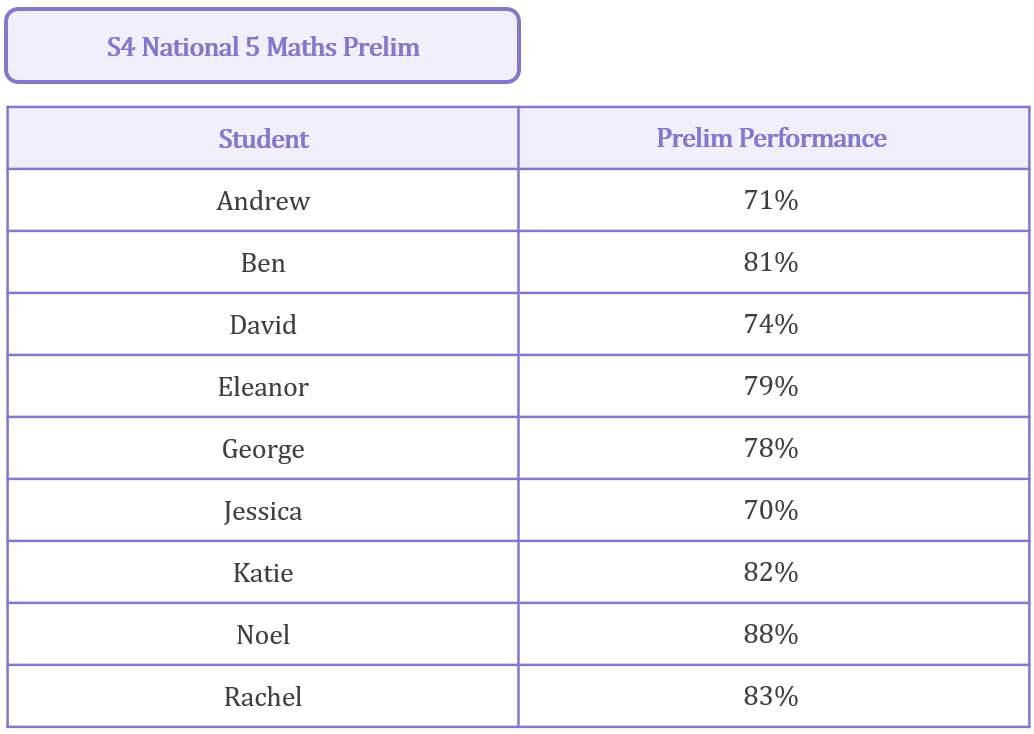
To find the median result for the class, first we have to arrange the results into numerical order:
71\%, 81\%, 74\%, 79\%, 78\%, 70\%, 82\%, 88\%, 83\%
![]()
70\%, 71\%, 74\%, 78\%, 79\%, 81\%, 82\%, 83\%, 88\%
Now we are ready to find the median. To find the median, count in from each side in equal steps until you meet in the middle:
70\% 71\% 74\% 78\% 79\% 81\% 82\% 83\% 88\%
As you can see, there are four results on either side of the 79% result which lies exactly in the middle. Therefore, the median result is 79%.
Because there were only 9 students in this class, and since 9 is an odd number, there is a result which lies exactly in the middle of the dataset which we can call our median.
For datasets with an odd number of datapoints, one datapoint will lie exactly in the middle of the set. This datapoint is the median.
For datasets which have an even number of datapoints, there is an additional step to take. Imagine another S4 class, this time with 10 pupils, sits their National 5 Maths prelim. Their results were as follows:
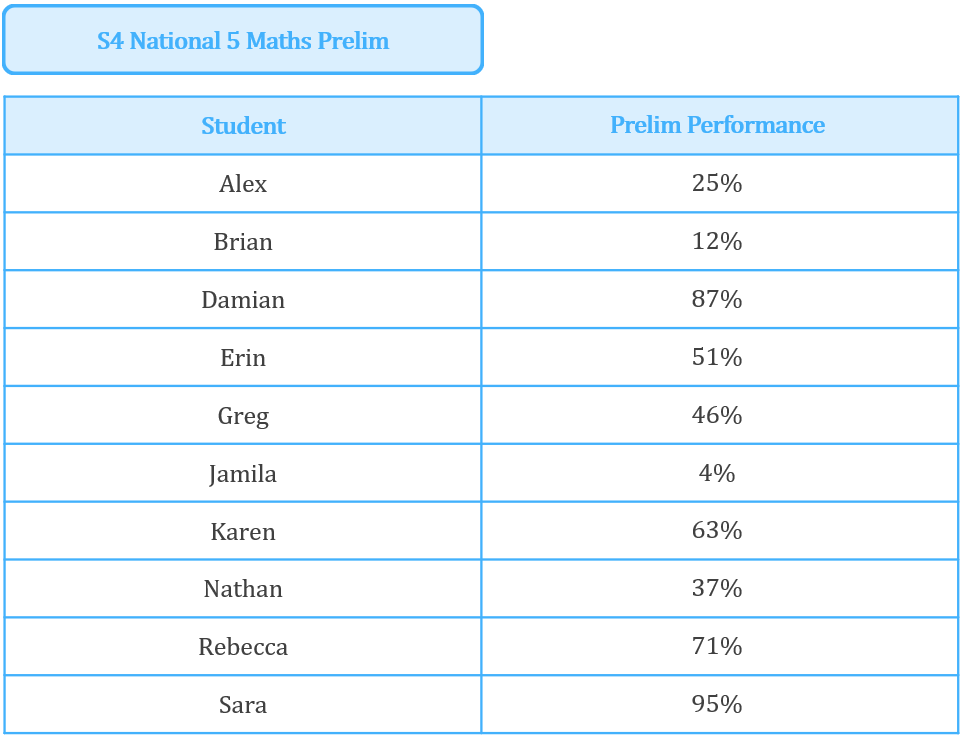
To find the median result for the class, first we have to arrange the results into numerical order:
25\%, 12\%, 87\%, 51\%, 46\%, 4\%, 63\%, 37\%, 71\%, 95\%
![]()
4\%, 12\%, 25\%, 37\%, 46\%, 51\%, 63\%, 71\%, 87\%, 95\%
Now we are ready to find the median. To find the median, count in from each side in equal steps until you meet in the middle:
4\% 12\% 25\% 37\% 46\% 51\% 63\% 71\% 87\% 95\%
This time, there are five results on either side and there’s no number which lies exactly in the middle.
For datasets with an even number of datapoints, no datapoint lies exactly in the middle of the set. For these datasets, to find the median we instead calculate the mean of the middle two results.
For our dataset, the two results closest to the middle are 46% and 51%. Therefore, the median can be calculated as:
\begin{aligned}&Median=Mean of middle two results \\[12pt]&Median=\frac{46\%+51\%}{2} \\[12pt]&Median=\frac{97\%}{2} \\[12pt]&Median=48.5\%\end{aligned}
The median result for this class is 48.5%. On a number line, it is easy to see that 48.5% lies exactly halfway between the two actual results (46% and 51%) that were closest to the centre of the dataset:
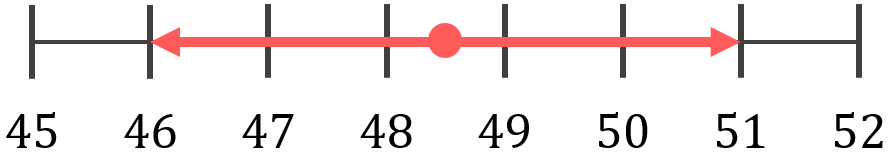
For datasets with an even number of datapoints, the median defines a true middle point. Exactly half of the results (51%, 63%, 71%, 87% & 95%) lie above the 48.5% median, and exactly half of the results (4%, 12%, 25%, 37% & 46%) lie below it.
Hopefully these examples have convinced you that finding the median is not that challenging. And it’s true, it’s not! However, it is absolutely critical that you make sure you’ve rearranged your dataset into numerical order before finding the median. Look what happens to our last example if we forget to rearrange the dataset before calculating the mean:
Original dataset of results:
25\%, 12\%, 87\%, 51\%, 46\%, 4\%, 63\%, 37\%, 71\%, 95\%
Splitting the results in half:
25\% 12\% 87\% 51\% 46\% 4\% 63\% 37\% 71\% 95\%
The two results closest to the “middle” this time are 46% and 4%. Attempting to calculate the median:
\begin{aligned}&Median=Mean of middle two results \\[12pt]&Median=\frac{46\%+4\%}{2} \\[12pt]&Median=\frac{50\%}{2} \\[12pt]&Median=25\%\end{aligned}
Clearly this is completely wrong! 25% is not the middle of the dataset – only 3 results (4%, 12% & 25%) lie at or below this value, whereas the other 7 results (37%, 46%, 51%, 63%, 71%, 87% & 95%) lie above it.
To cut a long story short – always sort your dataset into numerical order before calculating the median!
As a final point, let’s be very clear on the difference between the mean and the median as the two are often confused.
The mean is a figure which is representative of the dataset as a whole, or representative of the dataset “on average”. The median, much more simply, is literally just the number which physically lies in the middle of dataset when it is sorted into numerical order. The median may or may not be representative of the dataset as a whole depending on the dataset, but typically it will be different from the mean.
Key Outcomes
The median is the middle number in a dataset when it is ordered numerically.
A dataset must be sorted into numerical order before calculating the median.
To find the median, count in from each side of your dataset in equal steps until you meet in the middle.
For datasets with an odd number of datapoints, one datapoint will lie exactly in the middle of the set. This datapoint is the median.
For datasets with an even number of datapoints, no datapoint lies exactly in the middle. For these datasets, to find the median, calculate the mean of the middle two results.