

What is Mean?
The mean, or alternatively, the “arithmetic average”, is the sum of the values in a dataset divided by the number of values in the dataset.
\begin{aligned}\textbf{Mean}=\frac{\textbf{Sum of values in set}}{\textbf{Number of values in set}}\end{aligned}
The purpose of the mean is to calculate a figure which is representative of the dataset as a whole, or representative of the dataset “on average”.
For example, imagine a school has three classes of S4 pupils – Class A, Class B and Class C – who have all sat their National 5 Maths prelim. Each class has 10 pupils.
Class A’s results were as follows:
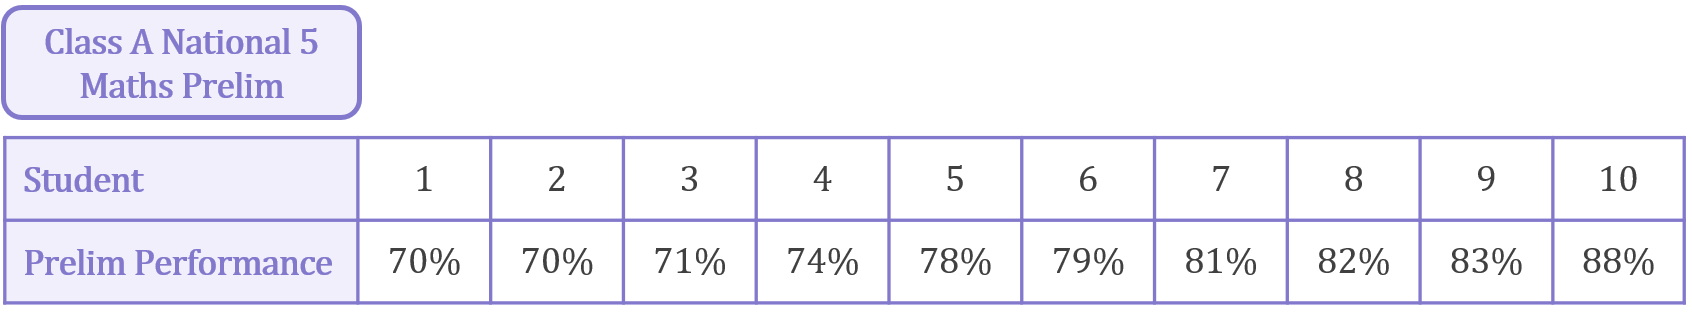
The mean or “average” result for Class A can be calculated:
\begin{aligned}&Class A Mean=\frac{Sum of results}{Number of results} \\[16pt]&Class A Mean=\frac{70+70+71+74+78+79+81+82+83+88}{10} \\[12pt]&Class A Mean=\frac{776}{10} \\[12pt]&Class A Mean=77.6\% \\[16pt]&Members of Class A scored 77.6\% on average.\end{aligned}
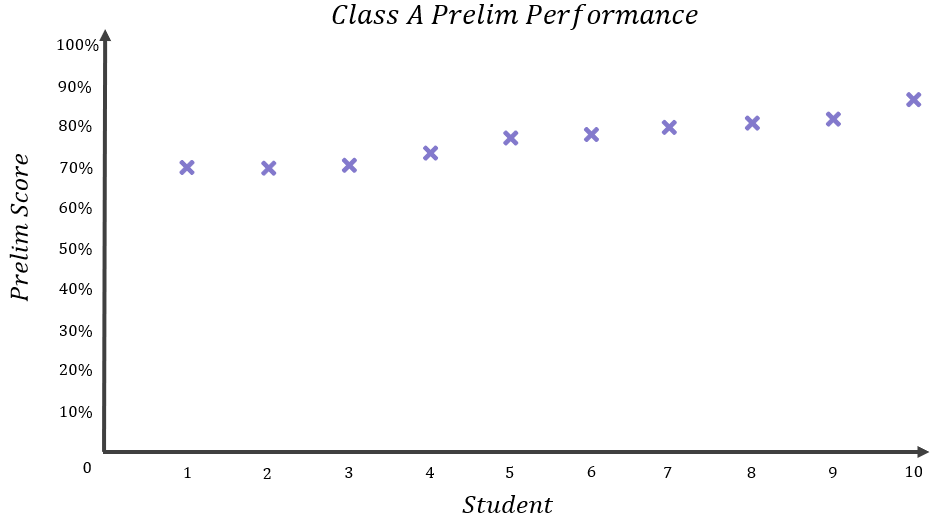
Looking at the spread of results across Class A, would you agree that a mean of 77.6% is a fairly good representation of what the typical class member might have achieved in the prelim? Let’s add a purple line to the graph of results to represent the mean score:
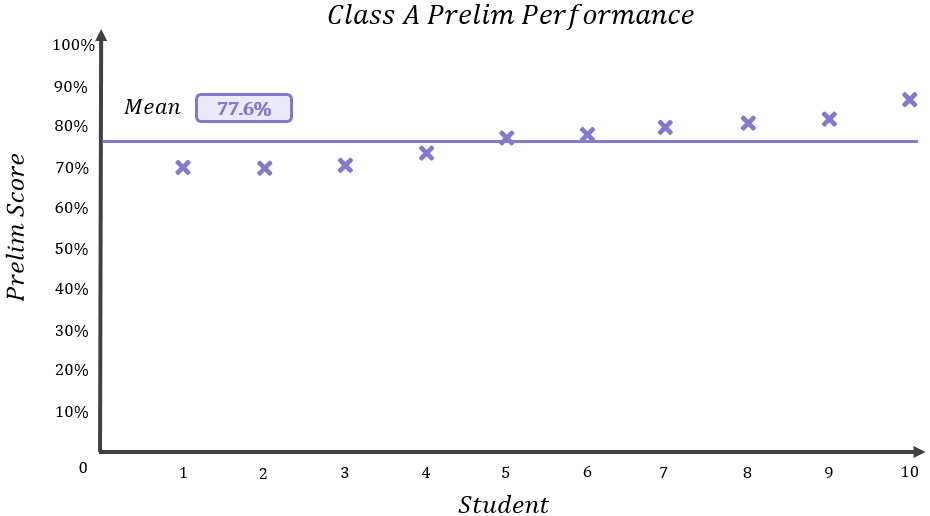
As you can see, the mean falls somewhere in the middle of the range of results, with nobody really scoring wildly more or less than 77.6%, so I think it offers a fairly accurate measure of how the class performed as a whole.
Now Class B. Class B’s results were as follows:
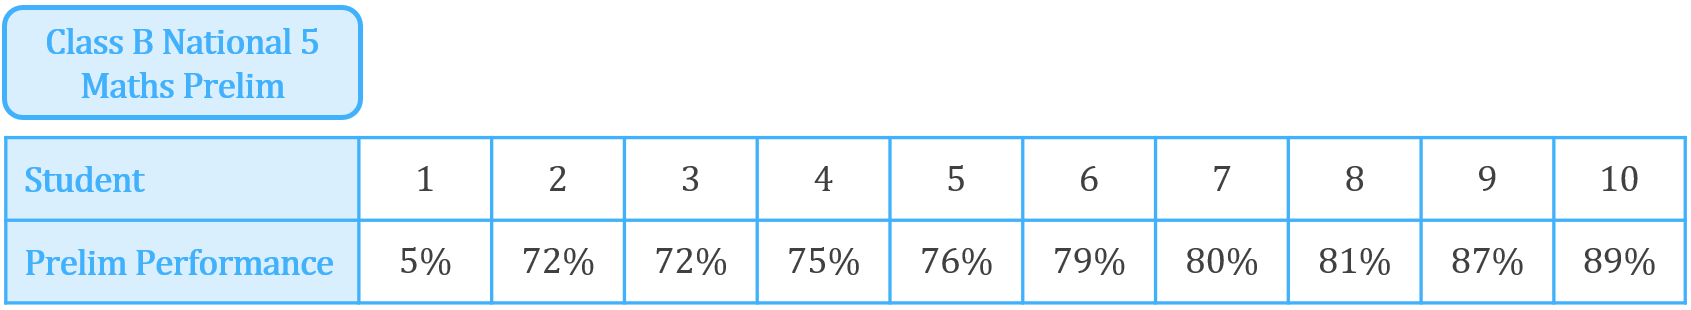
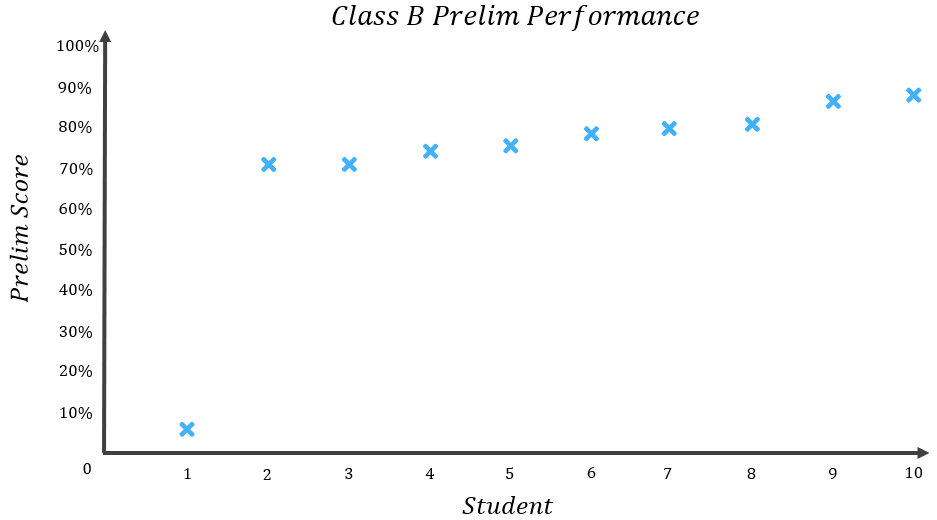
The mean or “average” result for Class B can be calculated:
\begin{aligned}&Class B Mean=\frac{Sum of results}{Number of results} \\[16pt]&Class B Mean=\frac{5+72+72+75+76+79+80+81+87+89}{10} \\[12pt]&Class B Mean=\frac{716}{10} \\[12pt]&Class B Mean=71.6\% \\[16pt]&Members of Class B scored 71.6\% on average.\end{aligned}
Do you think that a 71.6% average accurately describes what the typical member of Class B scored? Personally, I don’t think it does. Let’s add a blue line to the graph of results to represent the mean score:
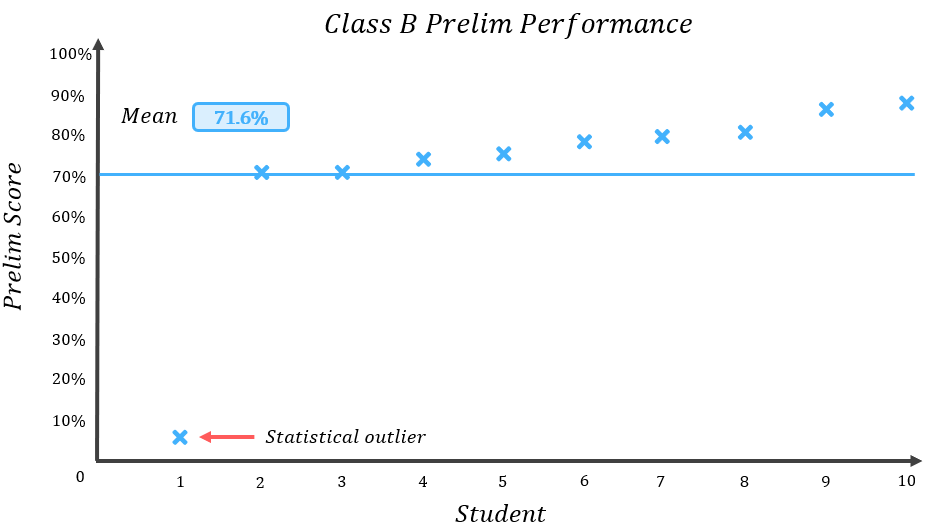
Comparing the results to the mean, we can see that everyone, other than the one student who bombed the test scoring only 5%, actually scored more than the mean result of 71.6%. 9 out of 10 of the students scored greater than the mean result – this means that in this case, the average is not a particularly good measure of the score of the typical class member.
So what went wrong? Well like Class A previously, all of Class B’s students scored in the 70-90% range, except for that one pupil who got only 5%. This pupil is a statistical outlier – a result which lies outside of the overall pattern of a distribution (with the distribution in this case being Class B’s prelim results). Statistical outliers in a dataset can skew the mean quite considerably, causing it to become a less accurate representation of the dataset as a whole.
The mean or average is often used improperly to gauge where “roughly the middle” of a dataset might be. The mean is not appropriate for this purpose. As we have seen with Class B, the mean or average can be a poor measure of central tendency as it is greatly influenced by statistical outliers in the dataset. (To actually find where the middle of a dataset is, you should use the median)
Let’s now look at Class C. Class C’s results were as follows:
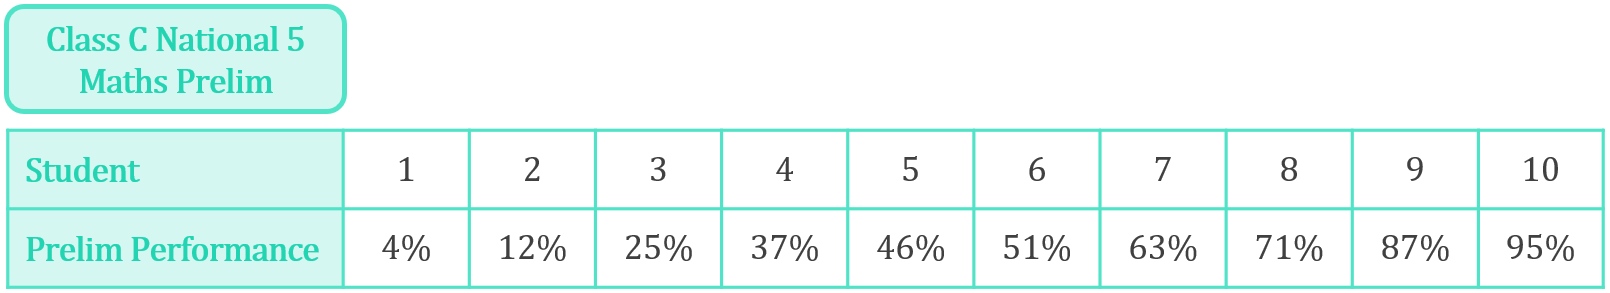
The mean or “average” result for Class C can be calculated:
\begin{aligned}&Class C Mean=\frac{Sum of results}{Number of results} \\[16pt]&Class C Mean=\frac{4+12+25+37+46+51+63+71+87+95}{10} \\[12pt]&Class C Mean=\frac{491}{10} \\[12pt]&Class C Mean=49.1\% \\[16pt]&Members of Class C scored 49.1\% on average.\end{aligned}
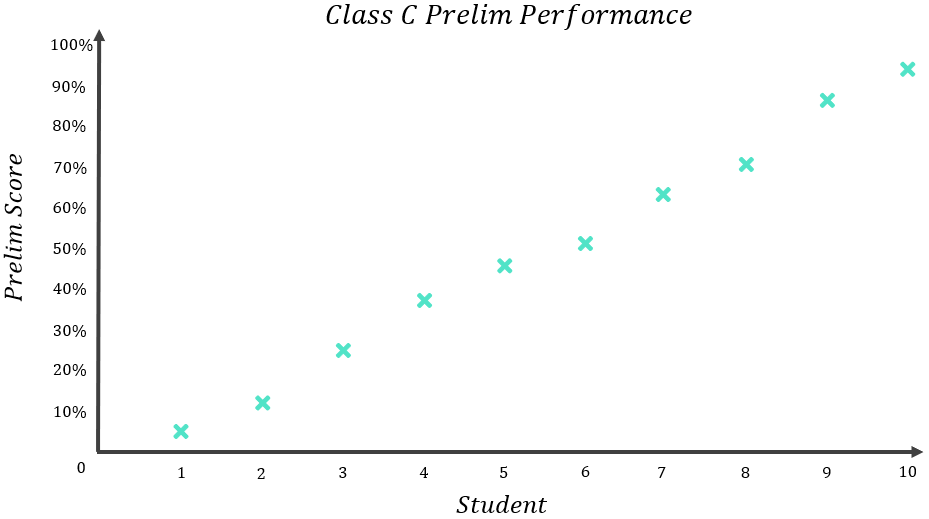
Do you think that a 49.1% average accurately describes what the typical member of Class C scored? I think it’s quite clear that this does not describe the class accurately at all! Let’s add a green line to the graph of results to represent the mean score:
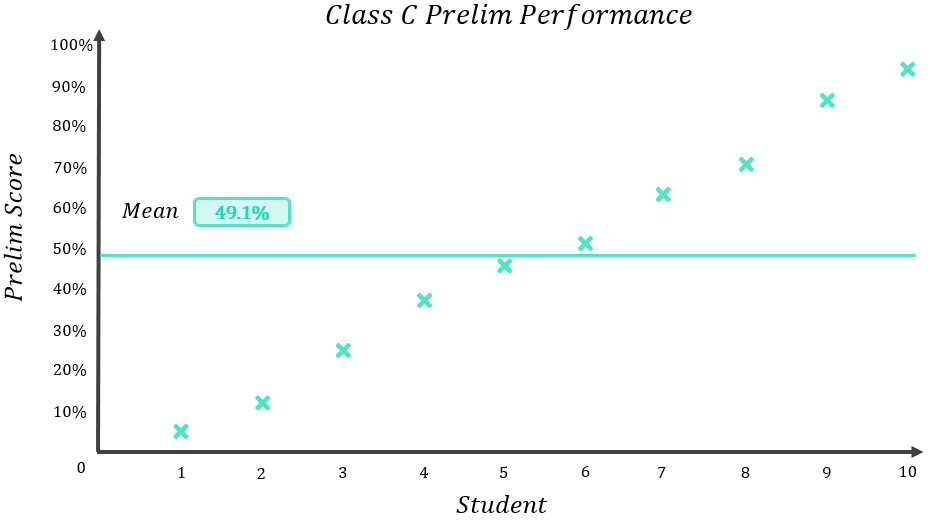
If you’re one of the students who scored 4% or 12%, a 49.1% average might sound quite good to you, but if you’re one of the students who scored 87% or 95%, you might be quite annoyed to hear people were saying your class only has a 49.1% average!
The problem with Class C’s set of scores is that they are highly dispersed – meaning that they are highly variable and cover a very wide range of results. For a dataset with such a high level of dispersion, the mean will not be a very accurate representation of the typical class member’s score.
There are a few outcomes we can draw from this exercise:
1) For narrow datasets with low dispersion (like Class A, where all the results were quite close to each other), the mean offers an accurate measure of a typical result.
2) For wide datasets with large dispersion (like Class C, where the results were very variable and covered a large range), the mean does not offer an accurate measure of a typical result.
3) Statistical outliers in a dataset can skew the mean quite considerably (like Class B, where all the results were close to each other except for the one student who got 5%), causing it to become a less accurate representation of the dataset as a whole.
4) The mean or average does not represent the “middle” of a dataset. Depending on the dataset, sometimes the mean can be very near the middle (like with Class A), but for other datasets it may not be (like Class B). To find the middle of a dataset, one should calculate the median.
As a final point, remember that a mean must always be read in context. Take for example a standard die:

This has 6 unique sides, numbered 1 through 6. On any one roll, it is equally likely that the die could show any value from 1 to 6, but on average, the die rolls a value of 3.5:
\begin{aligned}&Mean=\frac{Sum of possible results}{Number of possible results} \\[16pt]&Mean=\frac{1+2+3+4+5+6}{6} \\[12pt]&Mean=\frac{21}{6} \\[12pt]&Mean=3.5\end{aligned}
This is what I mean when I say a mean must be read in context. Yes, the die produces a value of 3.5 on average, but no single roll can actually show a value of 3.5 (since there is no side with 3.5 dots!) In this case, no single result can be the same the average value.
Sometimes, it is important to look more closely at the context of a mean calculation to fully understand it. If you looked at the calculation of the mean alone without understanding the limitations of a die (i.e. it can only show whole number values from 1 to 6), then you might think it was actually possible to roll a 3.5!
Key Outcomes
The mean, or alternatively the “arithmetic average”, is the sum of a collection of numbers in a dataset divided by the number of numbers in the dataset.
\begin{aligned}\text{Mean}=\frac{\text{Sum of values in set}}{\text{Number of values in set}}\end{aligned}
The purpose of the mean is to calculate a figure which is representative of the dataset as a whole, or representative of the dataset “on average”.
For narrow datasets with low dispersion, the mean offers an accurate measure of a typical result.
For wide datasets with large dispersion, the mean does not offer an accurate measure of a typical result.
Statistical outliers (results which lie outside of the overall pattern of a distribution) in a dataset can skew the mean quite considerably, causing it to become a less accurate representation of the dataset as a whole.
The mean or average does not represent the “middle” of a dataset. Depending on the dataset, sometimes the mean can be very near the middle, but for other datasets it may not be. To find the middle of a dataset, one should calculate the median.