What is Gradient?
Let’s start with a basic definition of gradient before delving into more detail:
In the General Equation of a Straight line \boldsymbol{y=mx+c}, \boldsymbol{m} is the gradient.
The gradient defines the slope, or how “steep” a line is. The larger the gradient, the more steeply sloped a line is. The smaller the gradient, the less steeply sloped a line is.
Let’s take two simple lines with different gradients: y=x and y=2x

Some of the coordinates for these lines are given below:
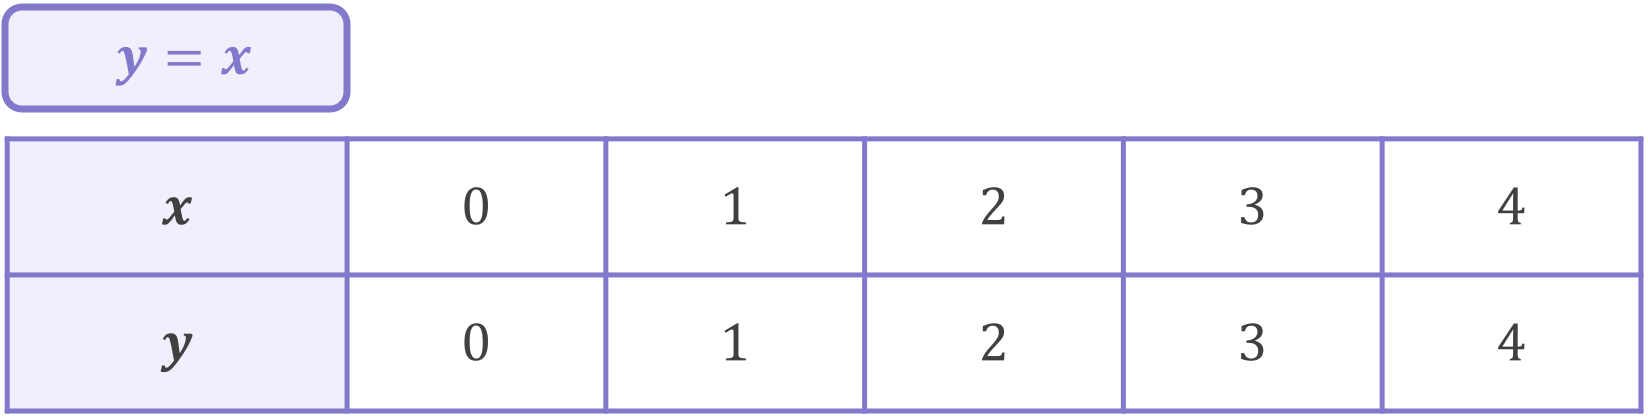
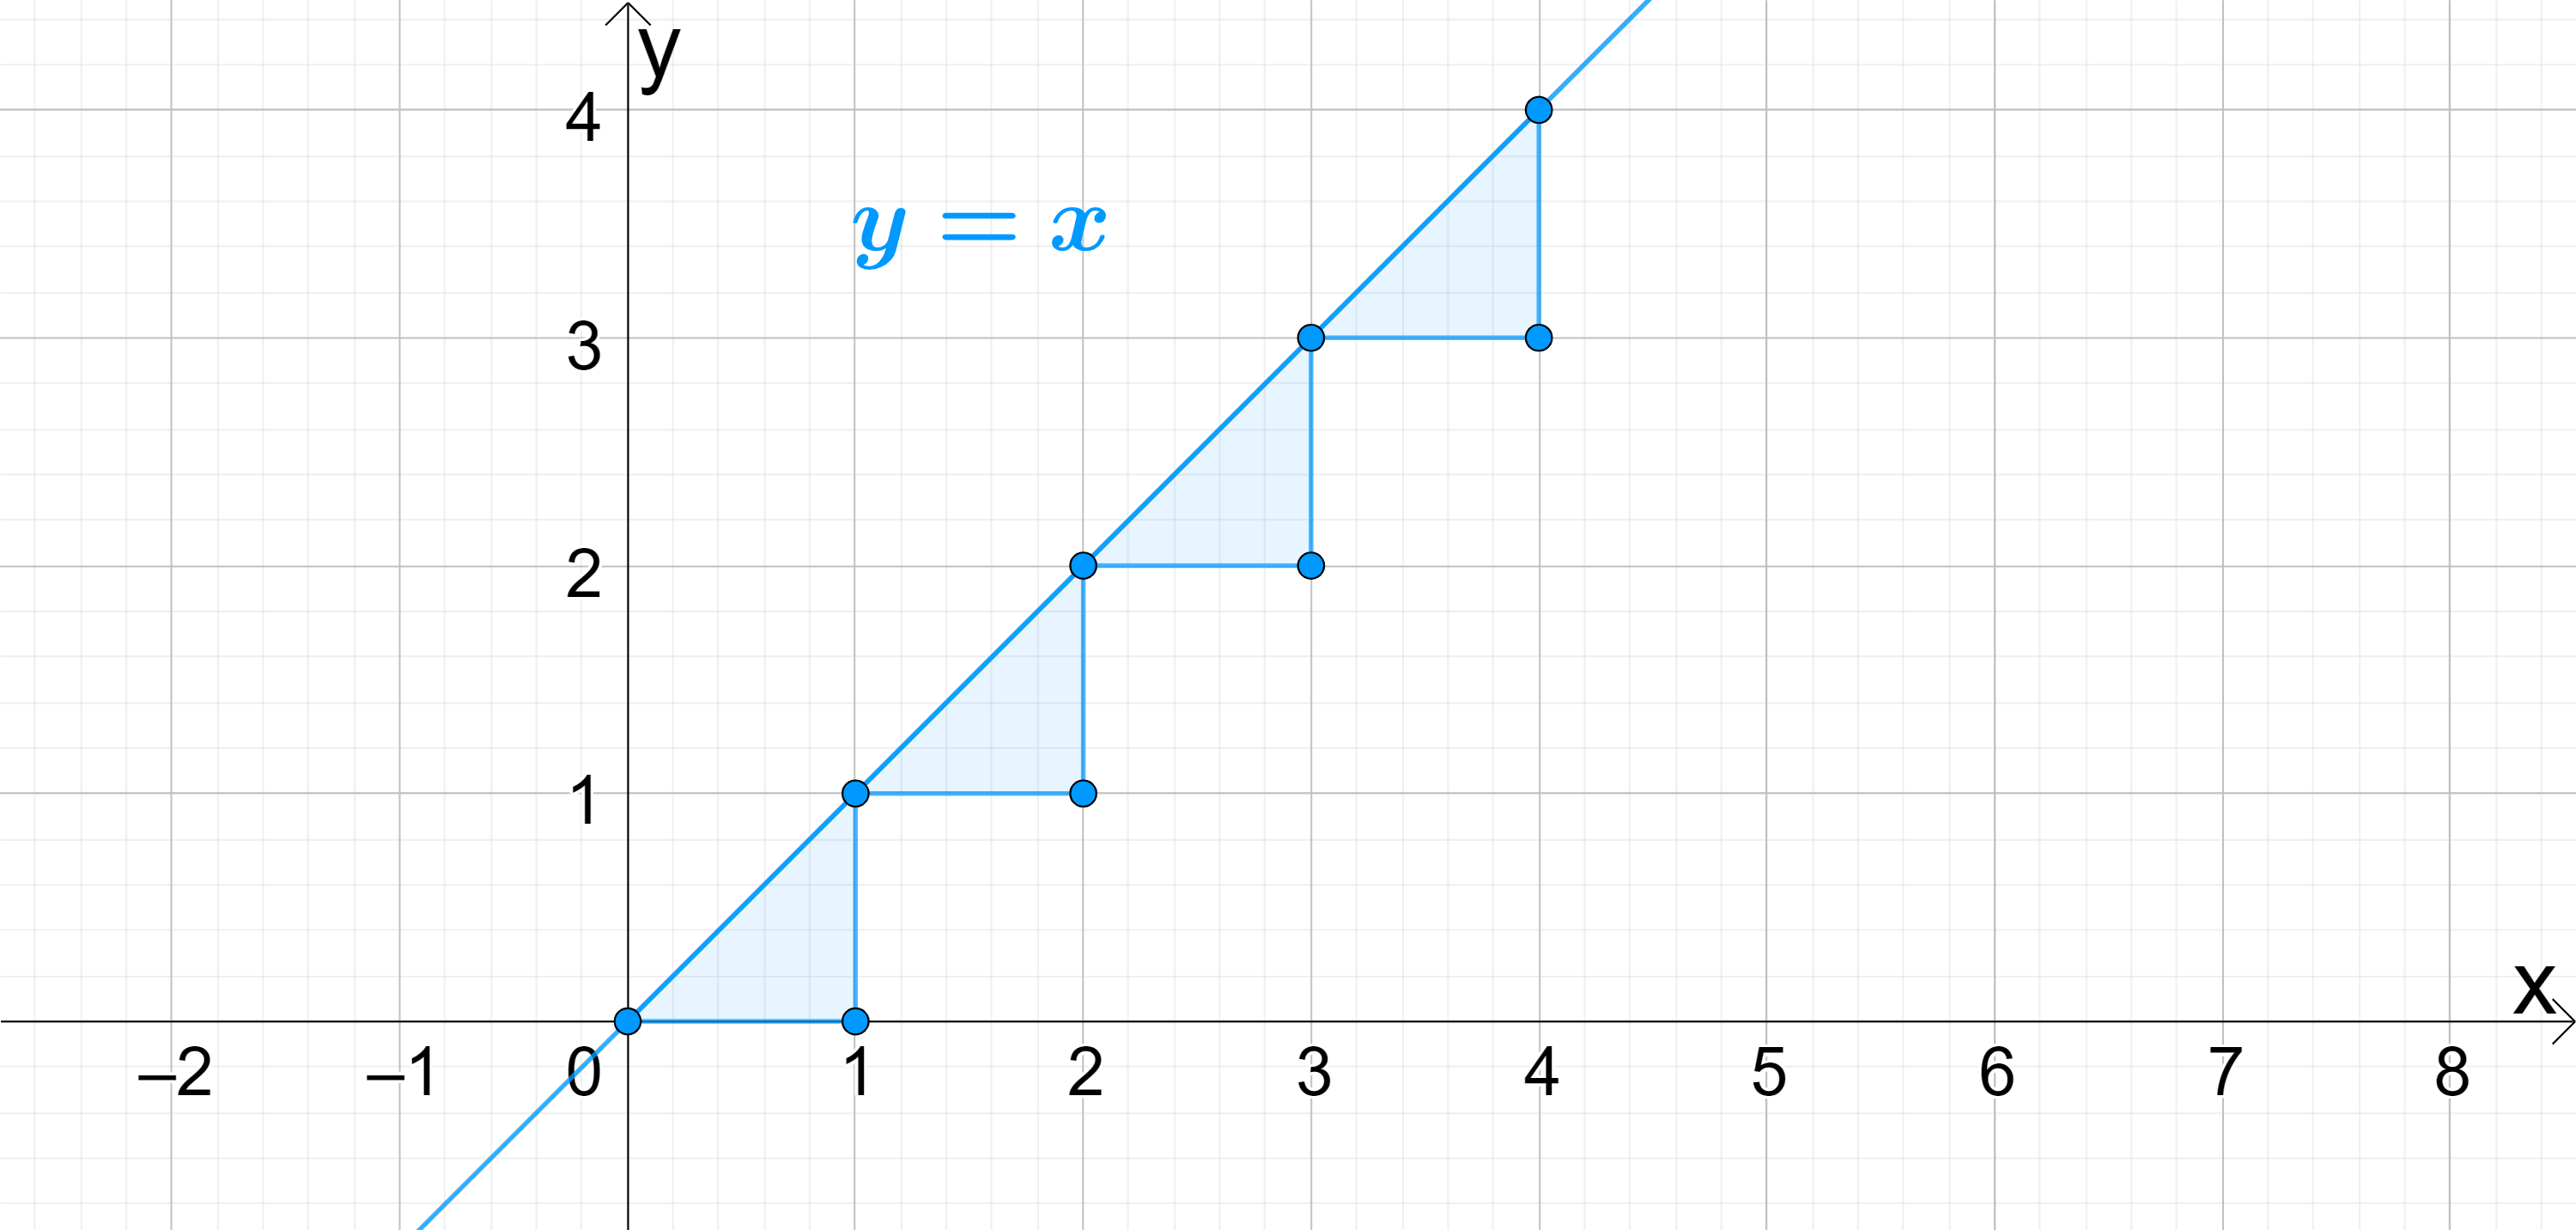
The first line, equation y=x, has a gradient of m=1. When we plot the line y=x, notice that every time x increases by 1, y also increases by 1:
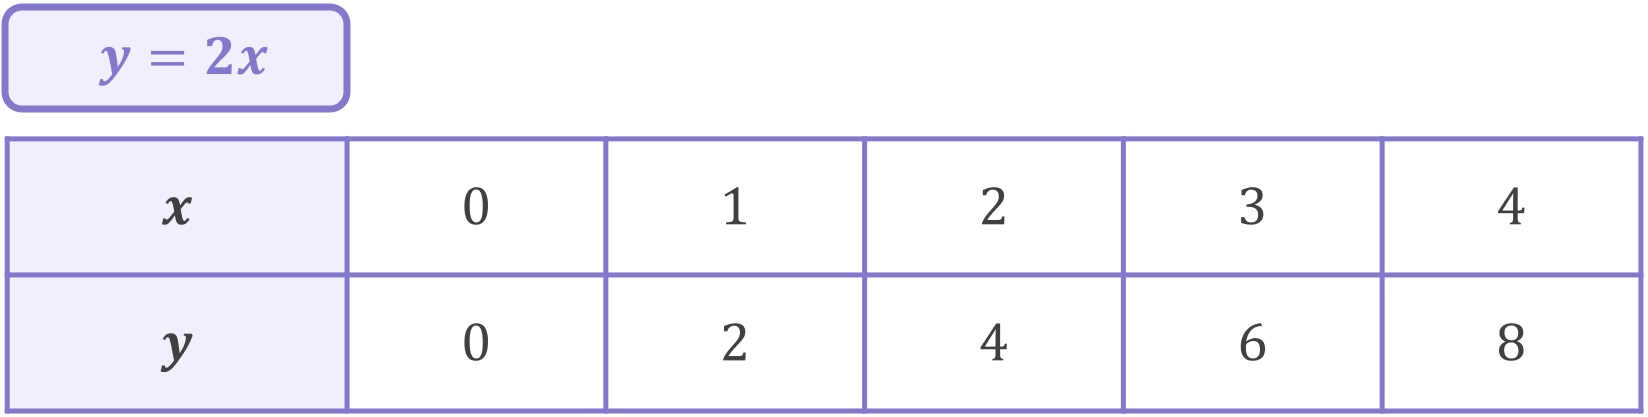
The second line, equation y=2x, has a gradient of m=2. When we plot the line y=2x, notice that every time x increases by 1, y instead increases by 2:

The gradient of a line can be thought of as the change in \boldsymbol{y} for every jump of 1 in \boldsymbol{x}. For the first line, y=x, which has a gradient of 1, when x increased by 1, y also increased by 1. For the second line, y=2x, which has a gradient of 2, when x increased by 1, y increased by 2. This relationship holds true for any other line. If we had another line, say y=\frac{1}{2}x, the gradient is m=\frac{1}{2}, so when x increases by 1, y will increase by \frac{1}{2}.
If you know a line’s equation, then you can simply read off its gradient. However, if you do not yet have a line’s equation, you need to calculate the gradient directly. Fortunately, there is a formula for this:
The gradient of any line can be calculated using the gradient formula:
\begin{aligned}\boldsymbol{m=\frac{y_{2}-y_{1}}{x_{2}-x_{1}}}\end{aligned}
Where:
– \boldsymbol{(x_{1}, y_{1})} are the \boldsymbol{x} and \boldsymbol{y} components of a first coordinate on the line; and
– \boldsymbol{(x_{2}, y_{2})} are the \boldsymbol{x} and \boldsymbol{y} components of a second coordinate on the line
In English, this formula essentially just says:
\begin{aligned}\text{Gradient}=\frac{\text{Difference in}\ y\ \text{values}}{\text{Difference in}\ x\ \text{values}}\end{aligned}
Notice that to calculate the gradient of any line, you only need to know two coordinates on the line. Any two coordinates will work; they do not need to be coordinates which are “next to” each other.
Take for example the line y=3x. Since we have the formula of the line, we already know its gradient is 3, but let’s prove this to ourselves by calculating the gradient directly using coordinates from the line:
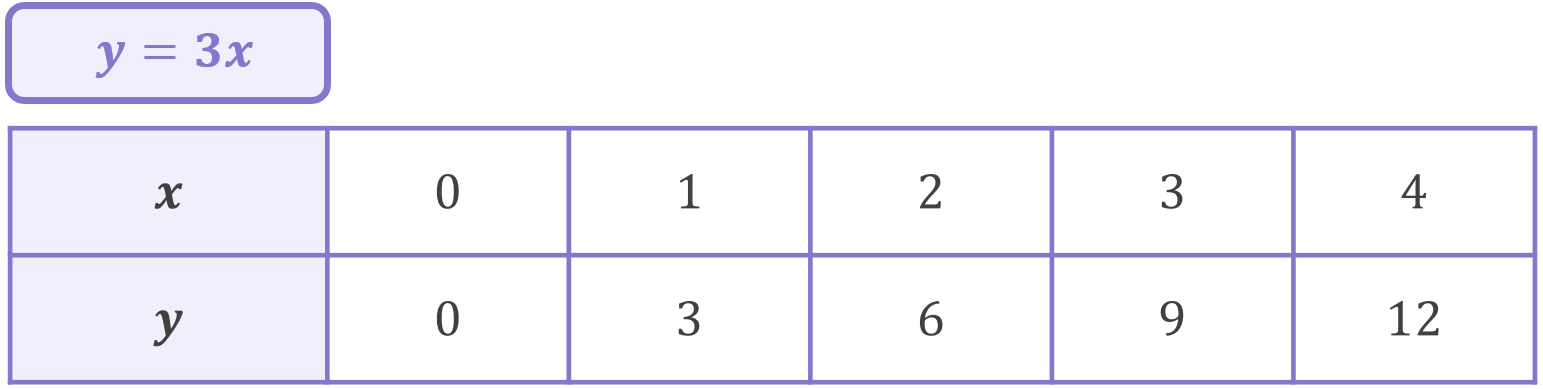
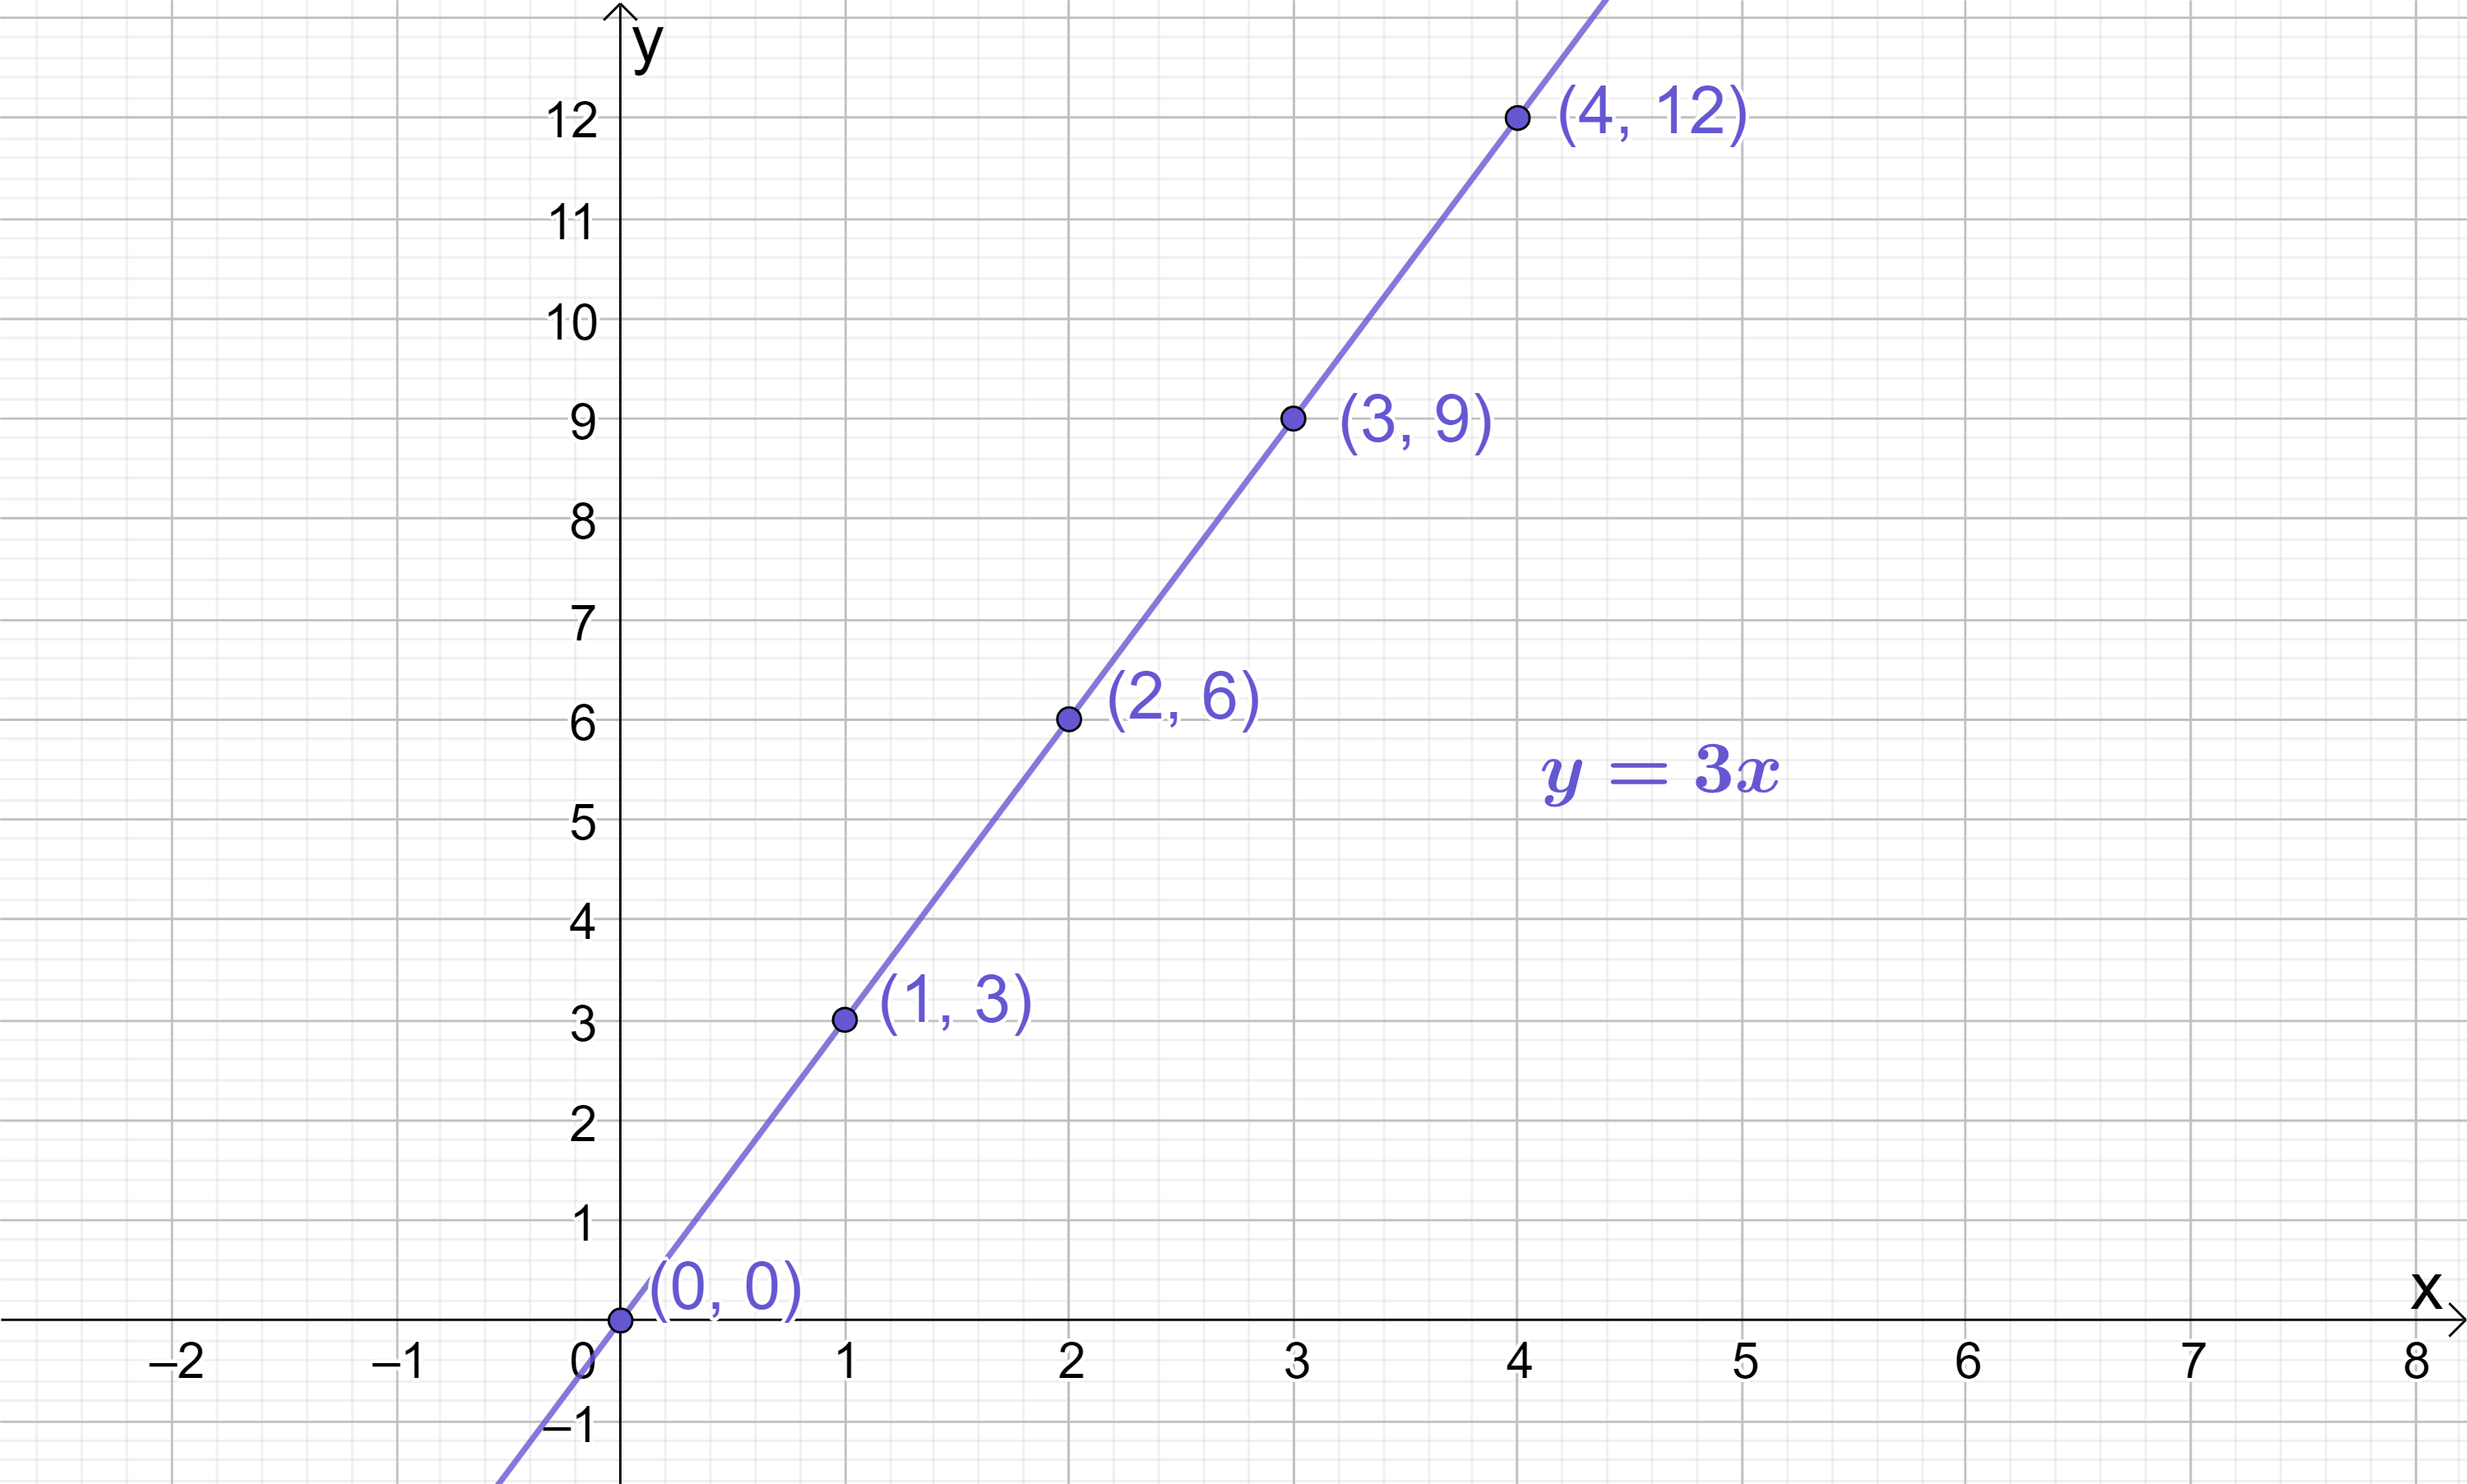
We need to choose two coordinates to use to calculate the gradient – let’s go with (1, 3) and (2, 6) (chosen at random). Using (x_{1}, y_1)=(1, 3) and (x_{2}, y_2)=(2, 6) we can calculate the gradient using the gradient formula:
\begin{aligned}m&=\frac{y_2-y_1}{x_2-x_1} \\[12pt]m&=\frac{6-3}{2-1} \\[12pt]m&=\frac{3}{1} \\[12pt]m&=3\end{aligned}
It does not matter that we used (1, 3) and (2, 6) to prove the gradient of the line was 3 – we could have proved this using any two points on the line! Let’s confirm this by recalculating the gradient, this time using (0, 0) and (4, 12). Using (x_{1}, y_1)=(0, 0) and (x_{2}, y_2)=(4, 12), we can calculate the gradient using the gradient formula:
\begin{aligned}m&=\frac{y_2-y_1}{x_2-x_1} \\[12pt]m&=\frac{12-0}{4-0} \\[12pt]m&=\frac{12}{4} \\[12pt]m&=3\end{aligned}
As you can see, this returns exactly the same value for the gradient even though (0, 0) and (4, 12) are not points which lie “next to” each other. Any combination of two points can be used to calculate the gradient!
The simplest straight line of all is the line \boldsymbol{y=x}. This has a gradient of 1, a y-intercept of (0, 0) and all its coordinates have equal x and y components:
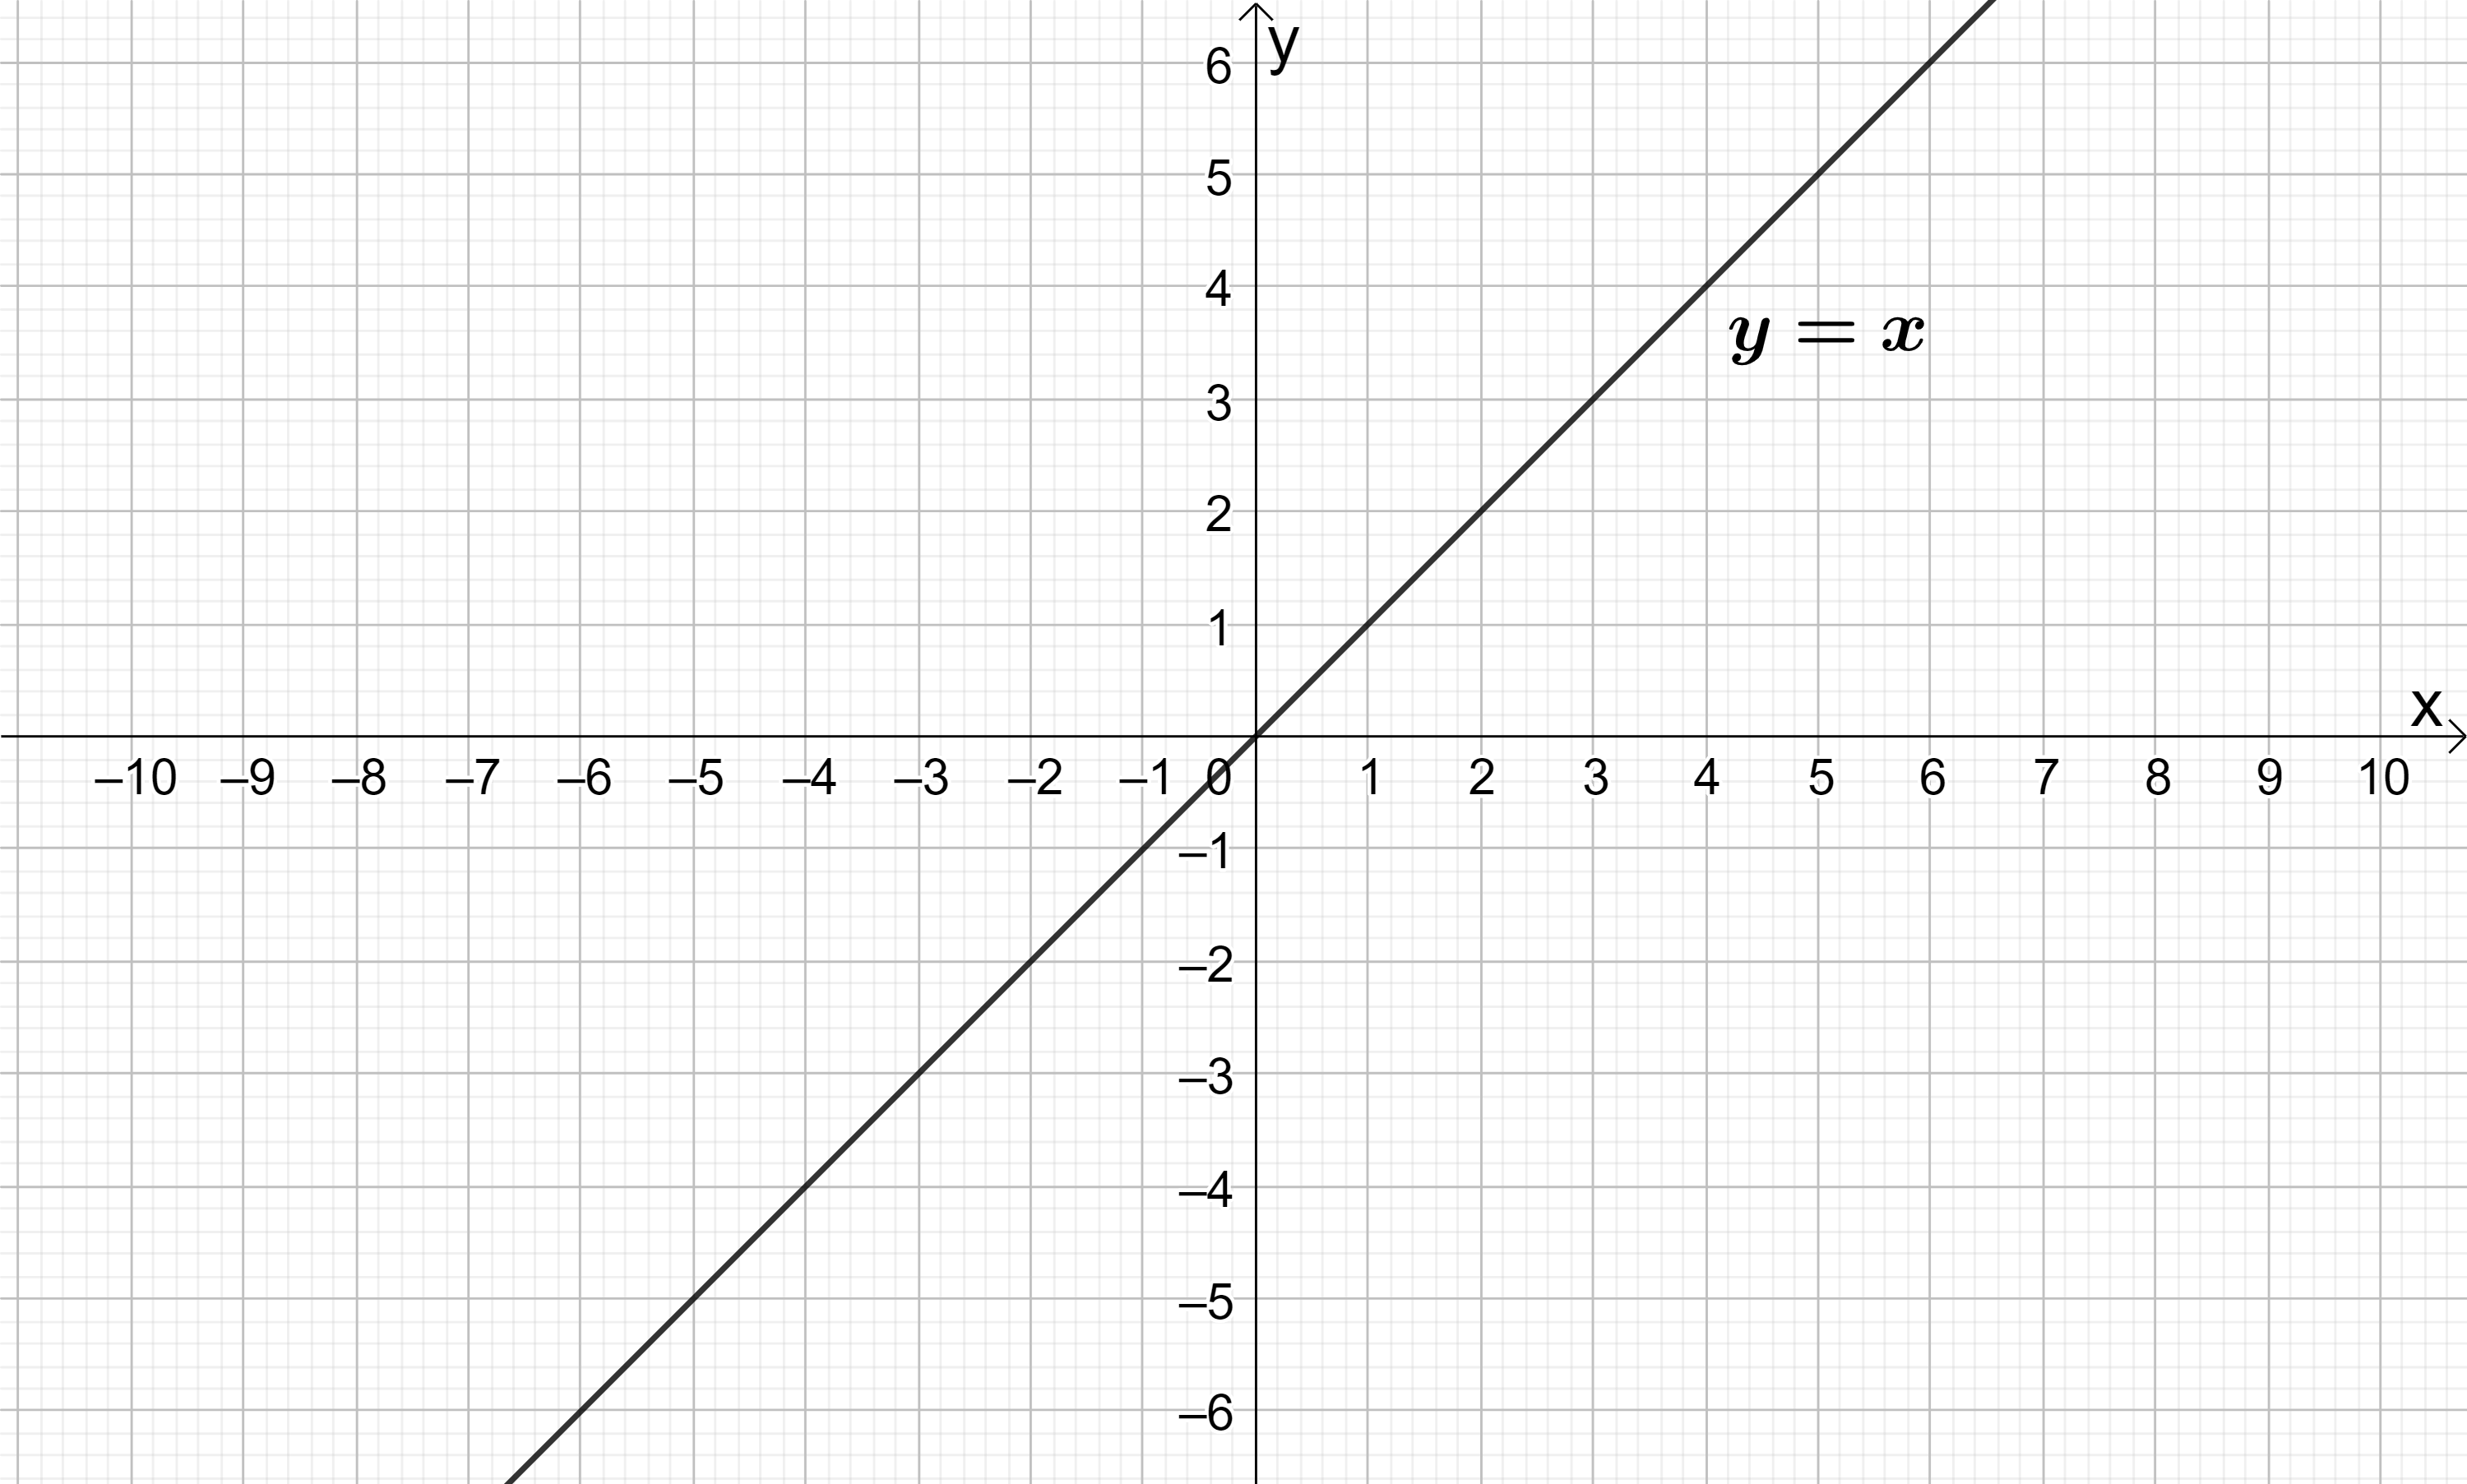
We can use this line as a reference to get a feel for how steep lines with other gradients should be.
Positive gradients
Lines with positive gradients are sloped upwards going from left to right. Some examples are shown below, using the line y=x as a reference:

Notice that as gradient increases above 1, the lines in the diagram become steeper. We could keep adding lines with larger and larger gradients to the diagram, like y=5x\ldots\ y=10x\ldots\ y=1000x and so on, and each line would be steeper than the last, until eventually the lines get so steep that they become perfectly vertical. When a line is perfectly vertical, its gradient is infinite; since we cannot quantify this numerically, we say the gradient of a vertical line is “undefined”.
As gradient decreases below 1 (but not below zero), the lines in the diagram become less steep. We could keep adding lines with smaller and smaller gradients to the diagram, like y=\frac{1}{5}x\ldots\ y=\frac{1}{10}x\ldots\ y=\frac{1}{1000}x and so on, and each line would be less steep than the last, until eventually the lines would lose their slope entirely and become perfectly horizontal (i.e. perfectly flat). Horizontal lines have zero gradient.
Negative gradients
Lines with negative gradients are sloped downwards going from left to right. Some examples are shown below, using the line y=-x as a reference:

The rule for positive gradients equally holds for negative gradients: the larger the gradient, the steeper the line; the smaller the gradient, the less steep the line.
Key Outcomes
The gradient defines the slope or the steepness of a line. The larger the gradient, the more steeply sloped a line is. The smaller the gradient, the less steeply sloped a line is.
The gradient of a line can be thought of as the change in y for every jump of 1 in x.
To calculate the gradient of any line, you need to know two coordinates on the line. Any two coordinates will work; they do not need to be coordinates which are “next to” each other.
The gradient of any line can be calculated using the gradient formula:
\begin{aligned}\boldsymbol{m=\frac{y_2-y_1}{x_2-x_1}}\end{aligned}
Where:
– (x_{1}, y_{1}) are the x and y components of a first coordinate on the line; and
– (x_{2}, y_{2}) are the x and y components of a second coordinate on the line
Lines with positive gradients are sloped upwards going from left to right.
Lines with negative gradients are sloped downwards going from left to right.
Vertical lines have undefined gradient.
Horizontal lines are flat so they have zero gradient: m=0